# Before processing, two datasets with numerous columns about distributions of
# different races and ancestries within cities
ancestry_df <- read.csv("./data/ancestry.csv")
race_df <- read.csv("./data/race.csv")Chris’ Midpoint Reflection
Midpoint Reflection

What I learned?
Data Manipulation and Preprocessing in R
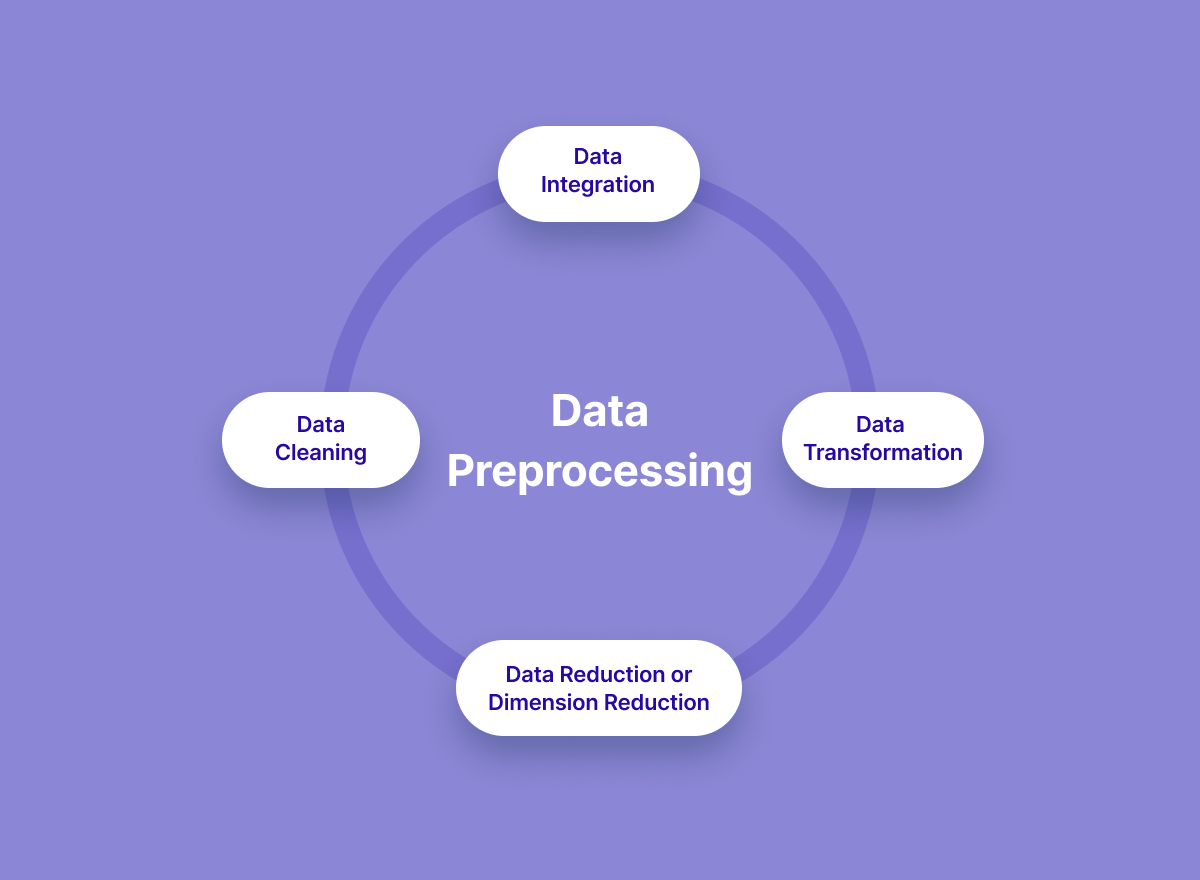
I collected and worked with around 10 datasets at the same time, which enables me to handle data proficiently to make the best insights. From normalizing the features / attributes to summarizing every individual data point by an index, my data processing skills have been improved a lot.
Results
Before processinng, two datasets with numerous columns about distributions of different races and ancestries within cities
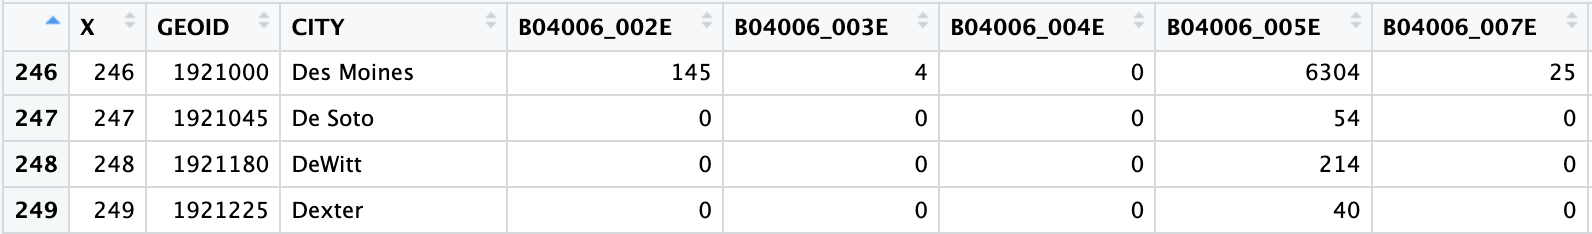 B04006_002E is the number of Afghan people with that city
# After processing, Simpson index indicates the diversity within a city
cultural_df <- read.csv("./data/ancestry_race.csv")
head(cultural_df, 5)
GEOID CITY SimpsonIndex_race SimpsonIndex_ancestry
1 1900190 Ackley 0.24674401 0.8196178
2 1900235 Ackworth 0.17250674 0.8134410
3 1900370 Adair 0.09779811 0.7921790
4 1900505 Adel 0.17635778 0.8601441
5 1900595 Afton 0.26618045 0.8464086# Similarly, the summary for social capital measures
social_df <- read.csv("./data/household_proficiency_commute.csv")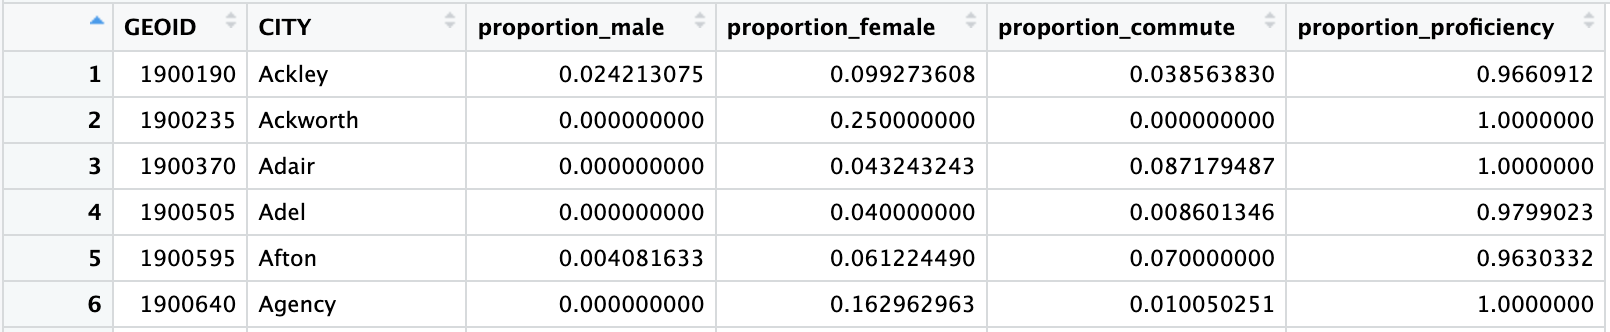
New directions…
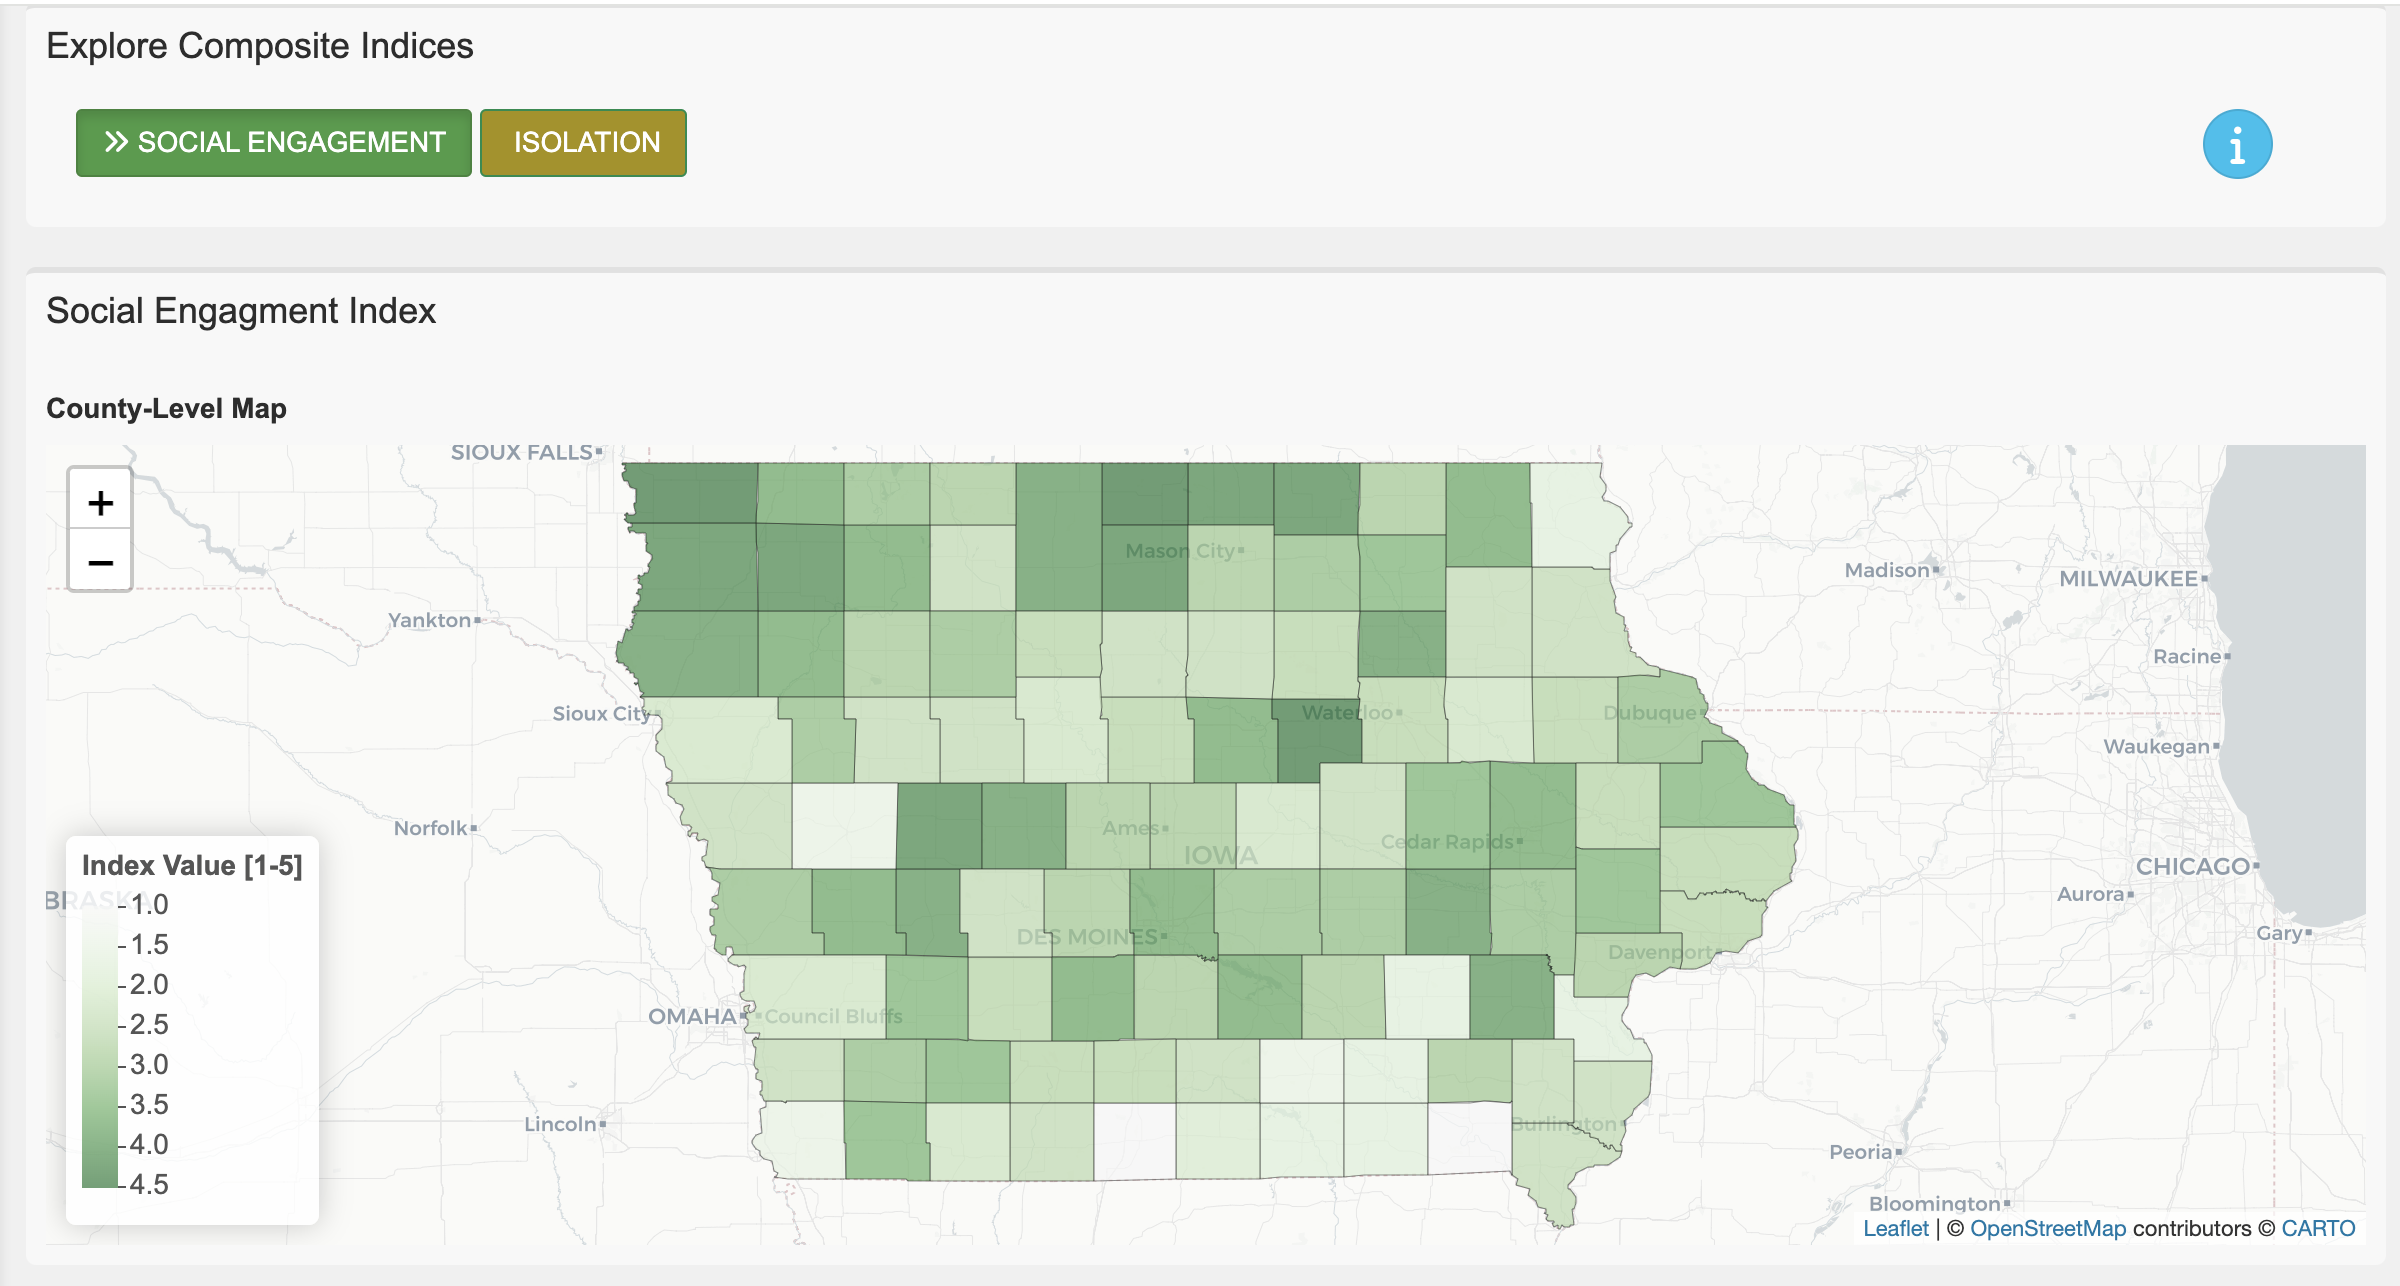
After collecting datasets for social and cultural measures, we may continue on some statistical analysis, summarising helpful insights that may be used in the interactive R Shiny dashboard.
 Besides, if time permits, we may do some modelings for our capital data, such as predicting improvemets in social capitals if some specific measures are increased.
Goals Met?
Not fully met, but I do learn many important skills, especially in R - a language I may never use during college if not attending DSPG. I also wish I could do some machine learning-based modeling, but let’s see…
Personally, I see a lot of improvements in soft skills such as presentation and English communication skills. I do also gain technical developments and helpful insights from the people I met and worked with. I may always need to remember the skills I learn today at DSPG such as data preprocessing and visualization skills. Besides, I do wish to learn more about other data skills such as data pipelines and data warehouse.
What to focus next?
I would say that I want to learn more fantastic skills to make cool visualization and helpful analysis in the field of social and cultural capitals.
I also hope to use more technologies to diversify my personal skills in the field of data science and analysis. Looking back on the beginning of the DSPG, I learned a lot of analysis skills. However, there’s still a lot of things to learn and make progress.