Blake’s Midpoint Reflection
Iowa Zoning guide map
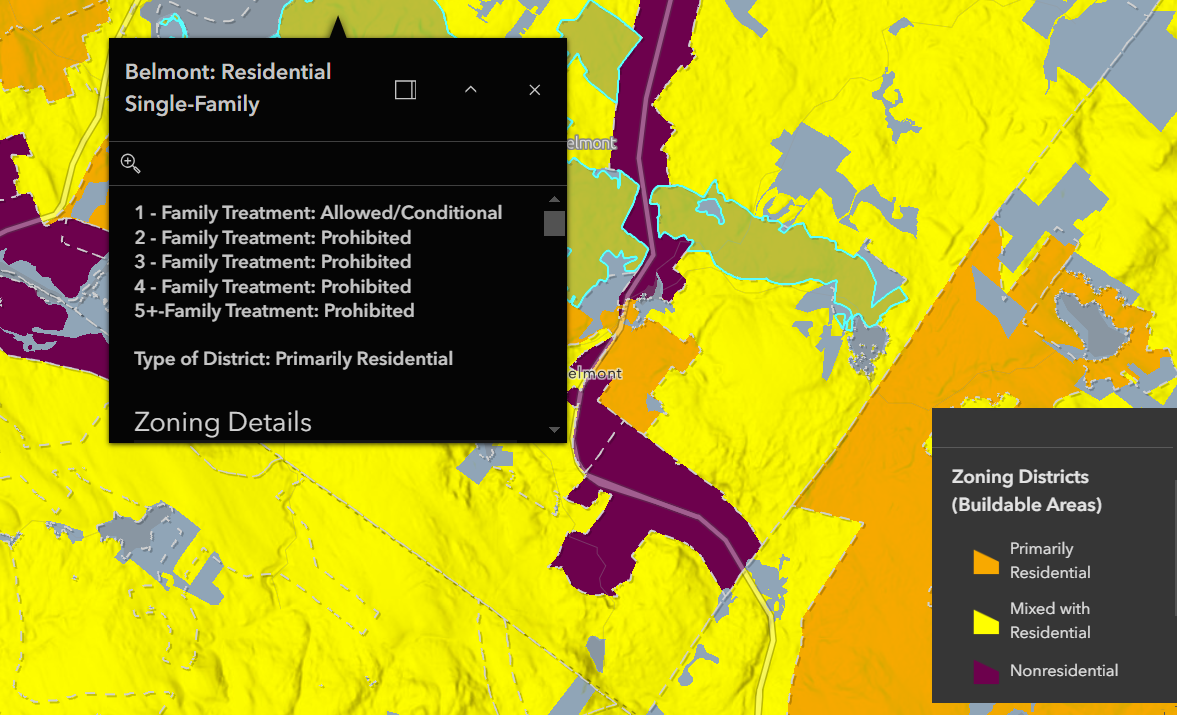
Throughout my first five weeks of DSPG, I have split my work between two areas. First, my colleagues and I have been building a dataset from collected data in zoning ordinances. The goal of this dataset is to create a visual guide map of all zoning codes in Iowa.
here is a visual of the type of app we are building:

Our zoning guide will show every area and whether it is residential or not, and after clicking on a specific district you will get plenty of information about that district and the zoning laws that apply to that district.
Analysis motivation
I am also working on further analysis of the zoning data on the housing market. I am using other high quality data sources as well the zoning data together to assist me in my analysis of the housing market across Iowa.
I am using R and Python for graphics and data processing while examining a few important metrics in such as median home value, median household income, and cost of rent from the Census Bureau website.
Housing market
An example of a map I made as part of my analysis, is a choropleth time series map in Tableau, showing the change in income and cost of living for neighborhoods across Iowa.
To investigate the future of the housing market, I created a linear model to estimate these metrics up to the year 2030.
Below is a sample of what I’ve been working on. The Tableau workbook contains four maps: (1) household income, (2) home value, (3) rent costs, and (4) my forecast map of household incomes until the year 2030. I broke down each area to the most granular level possible, so each boundary on the maps represents a block of about a couple of thousand people each.
future
Our analysis will continue to look at these types of variables but over time I will continue to add other metrics for analyzing the housing market such as calculating supply and demand for a city. I’m just getting started with this project but i’m off to a great start!