Make this Notebook Trusted to load map: File -> Trust Notebook
Tax Parcel and Model Extraction/Segmentation
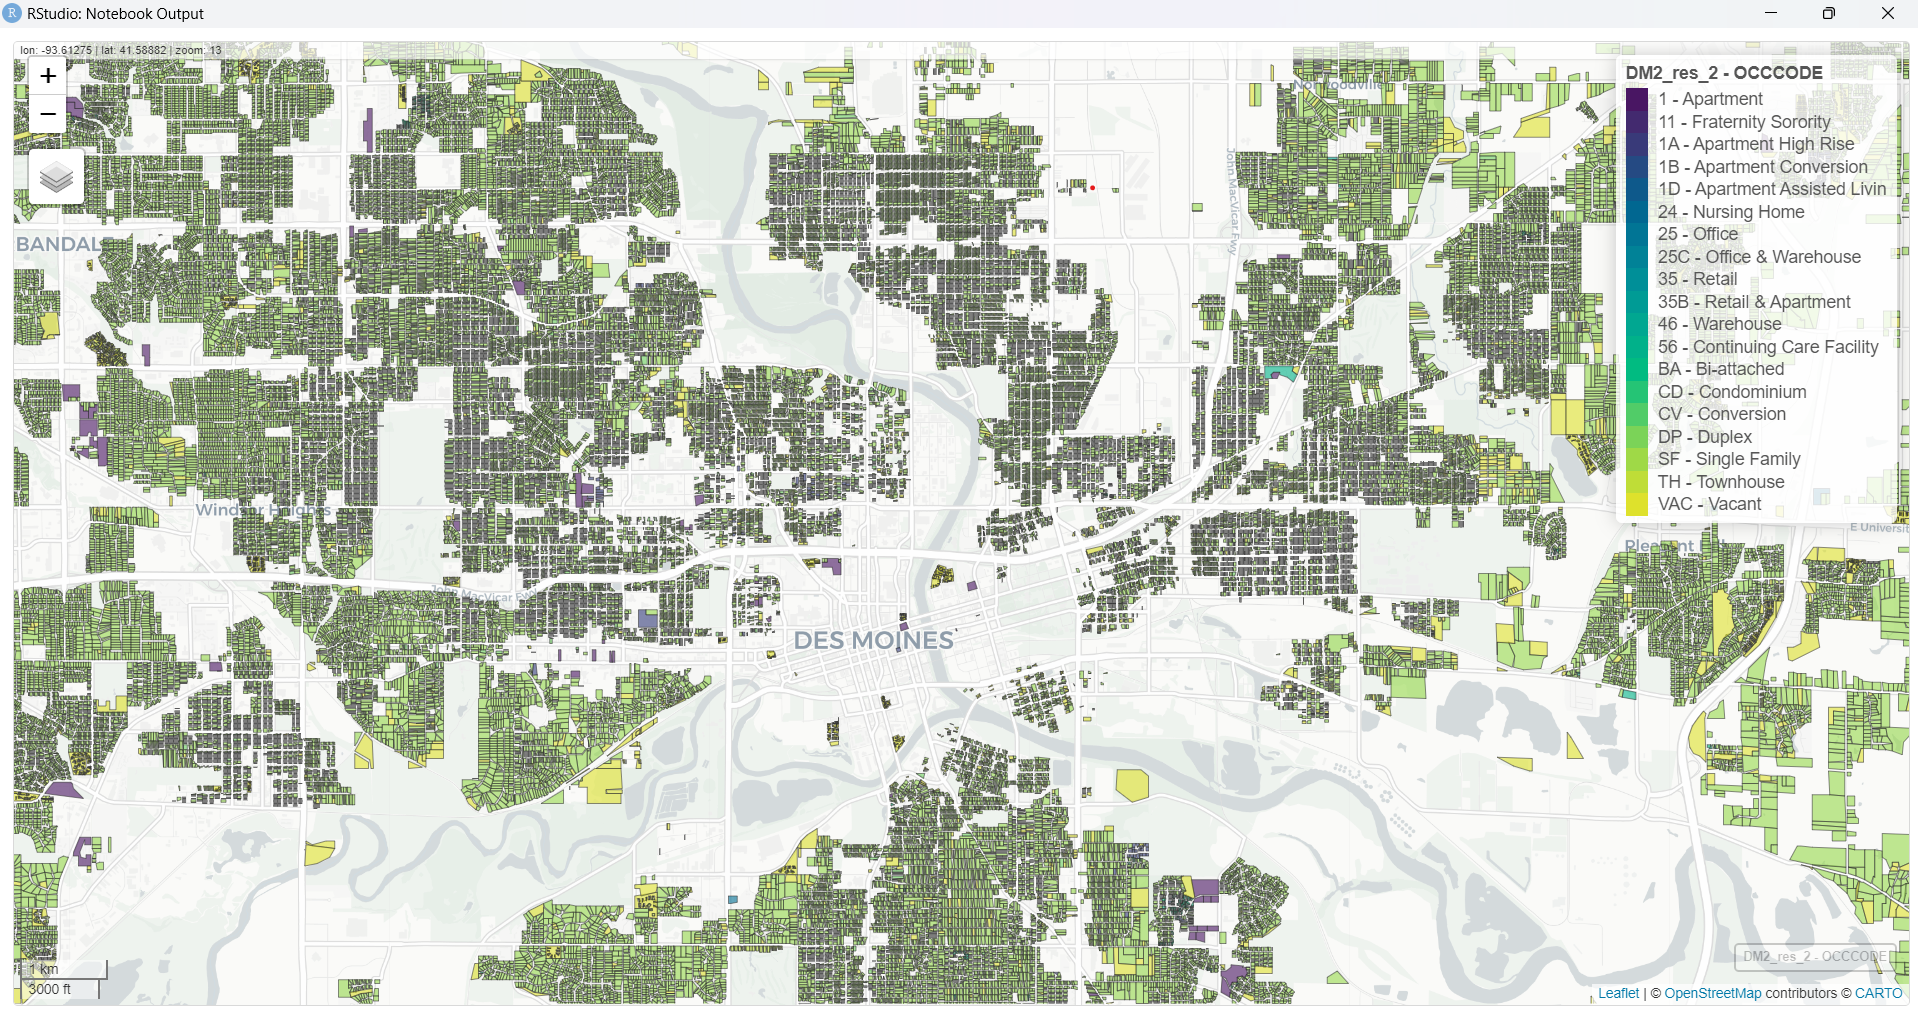
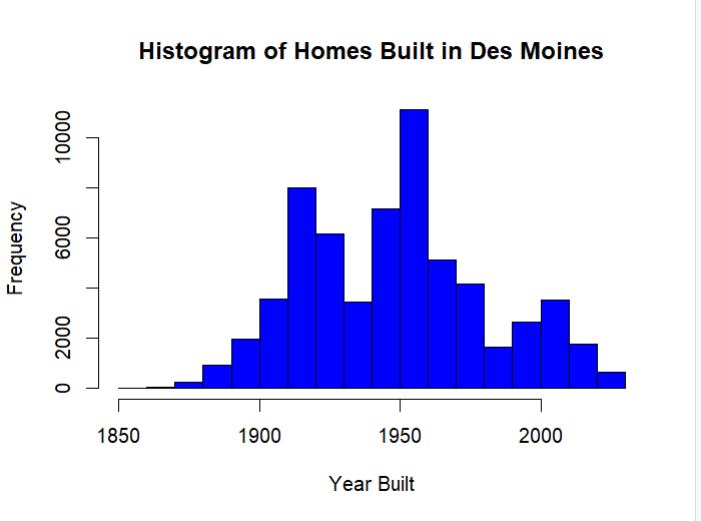
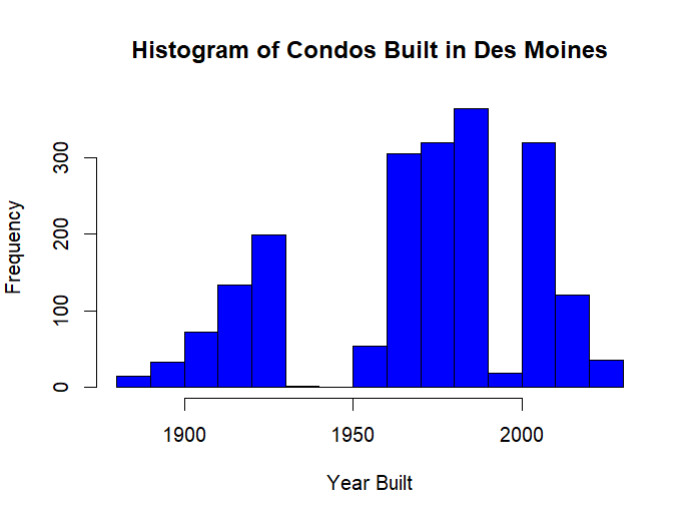
At the start of this week we were able to get a better dataset for the residential parcels in Polk county that does a better job of depicting which parcels actually contain housing units and how many units there actually are. It also helps divide the types of builds better ranging from single-family homes to apartments to nursing homes.
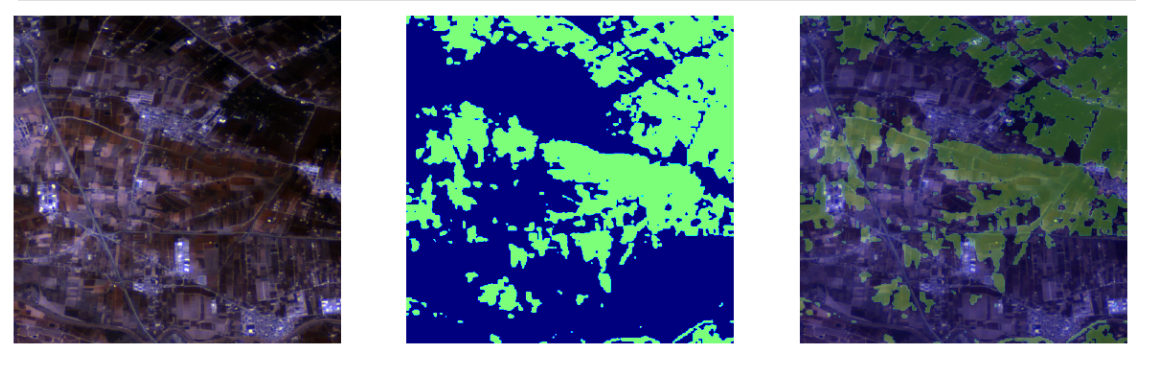
The other major project we are focusing on is parcel extraction/segmentation using the Prithvi model. The idea is that Prithvi is an object identification model that was trained on NASA’s satellite HSL data and then uses that to segment various objects. The good thing is that the “backbone” of this model can be downloaded and is pretrained. What we need to do is create a head and neck that can take our images and data that we have been gathering and then embed the image so it can be fed into the model and then turn it into a segmented mask that we can overlay on top of our images with the predicted parcels. This is so we can get around having to get every county’s assessor data and being able to apply it also for places that lack parcel level data.
Some work that has been done that we can base our model on comes in regards to flood detection on a satellite image.
More Data Visualization using leaflet
This week, I worked more with Leaflet maps and tried different things. First, I made a map using block group level data and it was easy because I got the geojason format data from ACS.
Then, I tried something harder: making maps for streets and small blocks. For the streets, I got data from HUD and used a tool called “Geocodio” to find their exact locations.
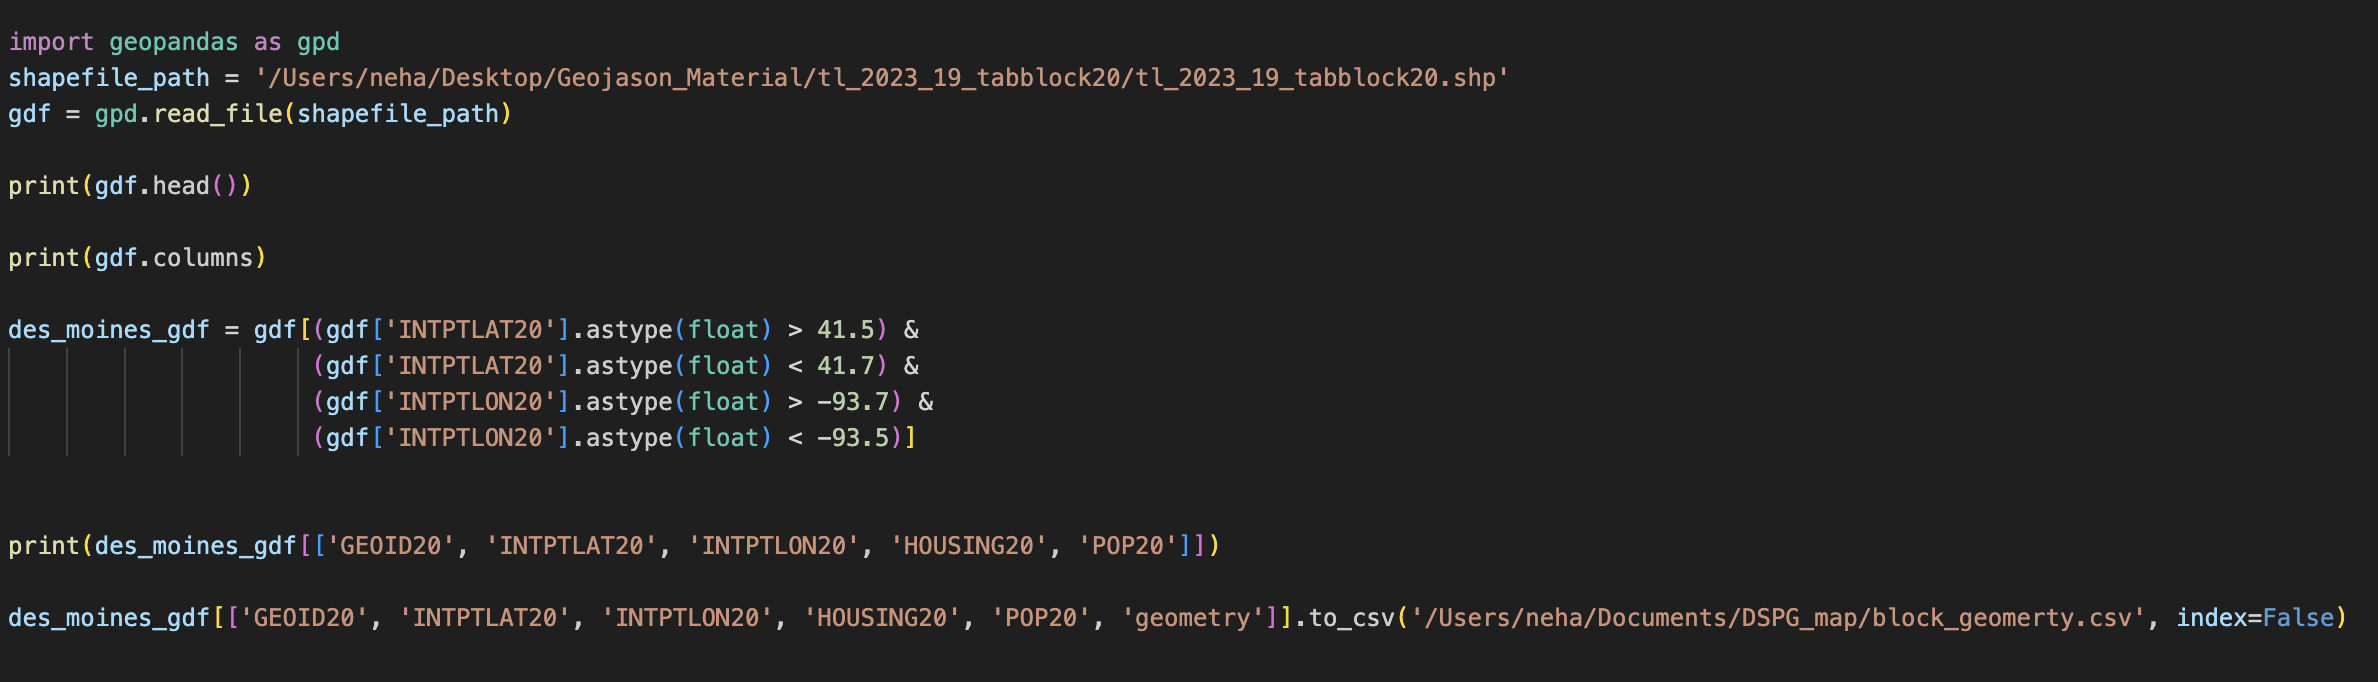
For small blocks, I looked at where majority of senior age groups live in Des Moines. I used something called Tiger Line to get the Geographic data, I converted the shp file to csv, and I only looked at Des Moines to keep it simple. Then, I combined all this data and used a tool called GeoPandas to organize it better and turn it into a type of map file called GeoJSON.
Next week, I want to make one function that does all this work. This means when someone gives it data, it will automatically make a map for them. This will make everything much easier and quicker.
Street level map for Low-Income Housing Tax Credit data
Seniors Age Distributation map in Des Moines
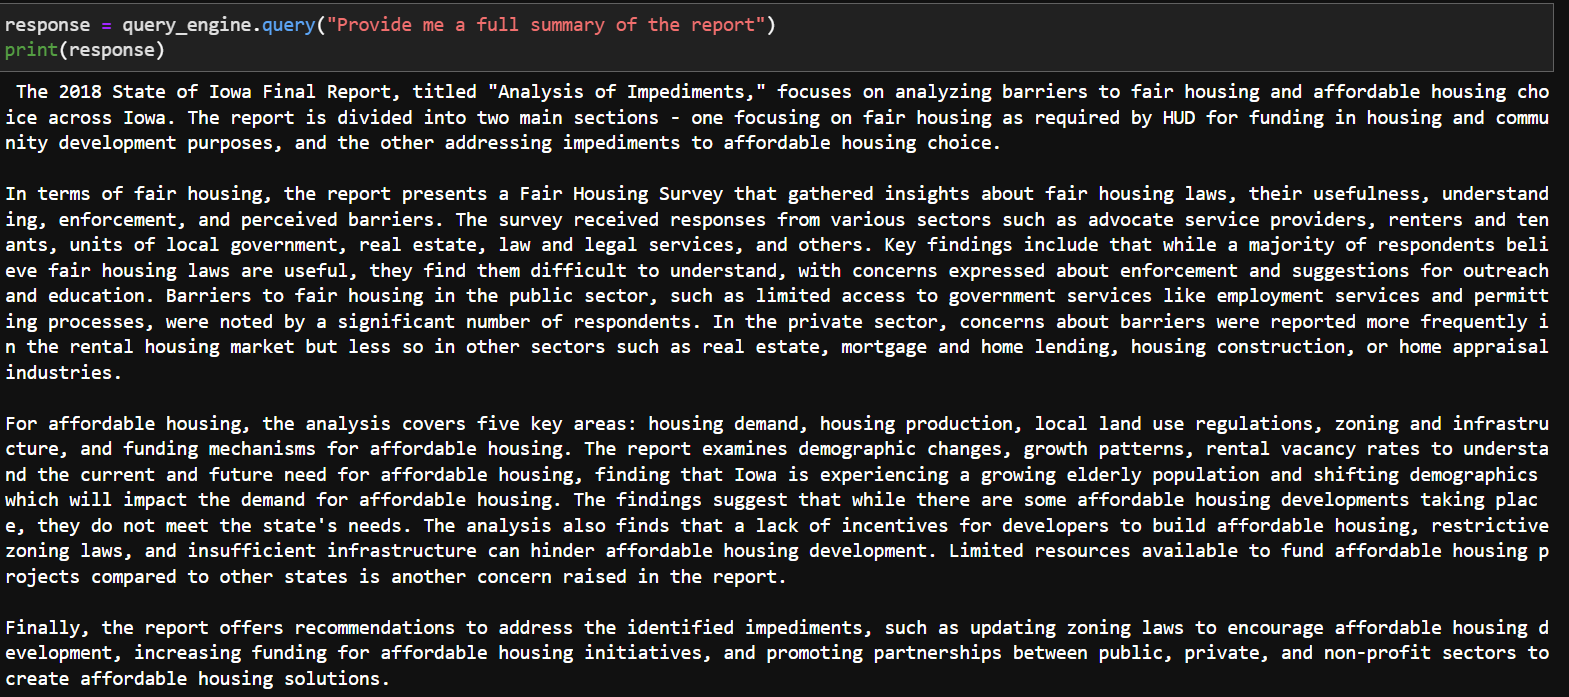
Llamaindex
Router Query Engine
- A custom query engine that select one of the several query engine candidates
Step 1: Get the nodes (chunks of the document) and index them

Step 2: Define query engines, and wrap them around the tools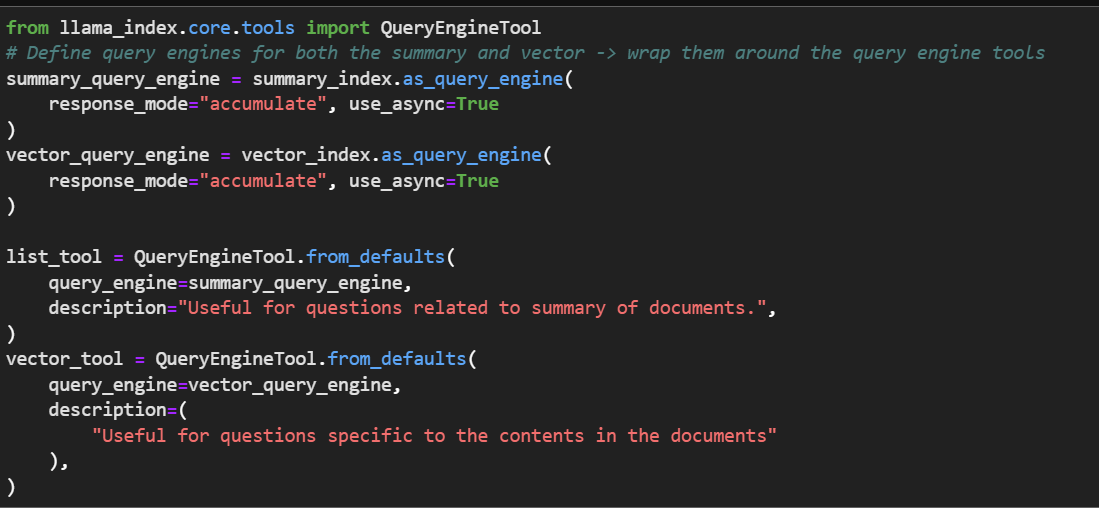
Step 3: Object index allows us to use our index data structures over objects, passed in to our agent for tool retrieving during query time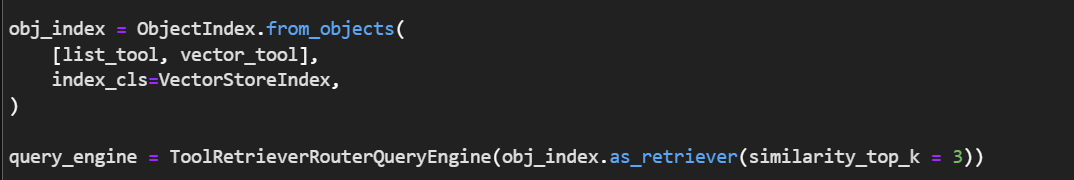
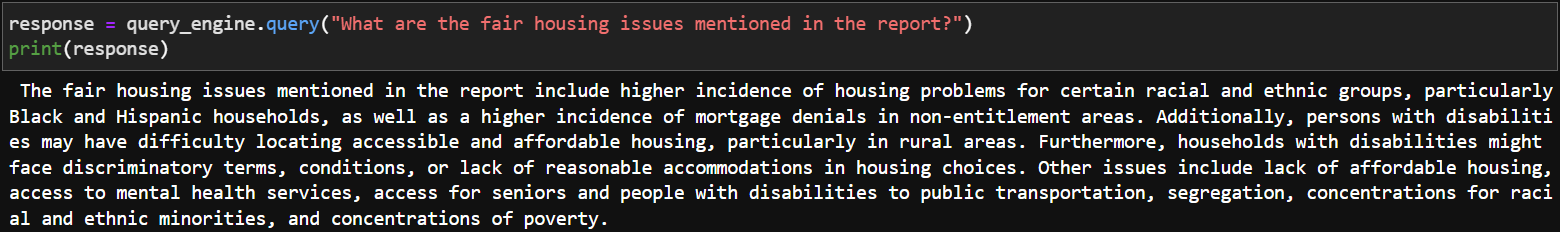
Results:
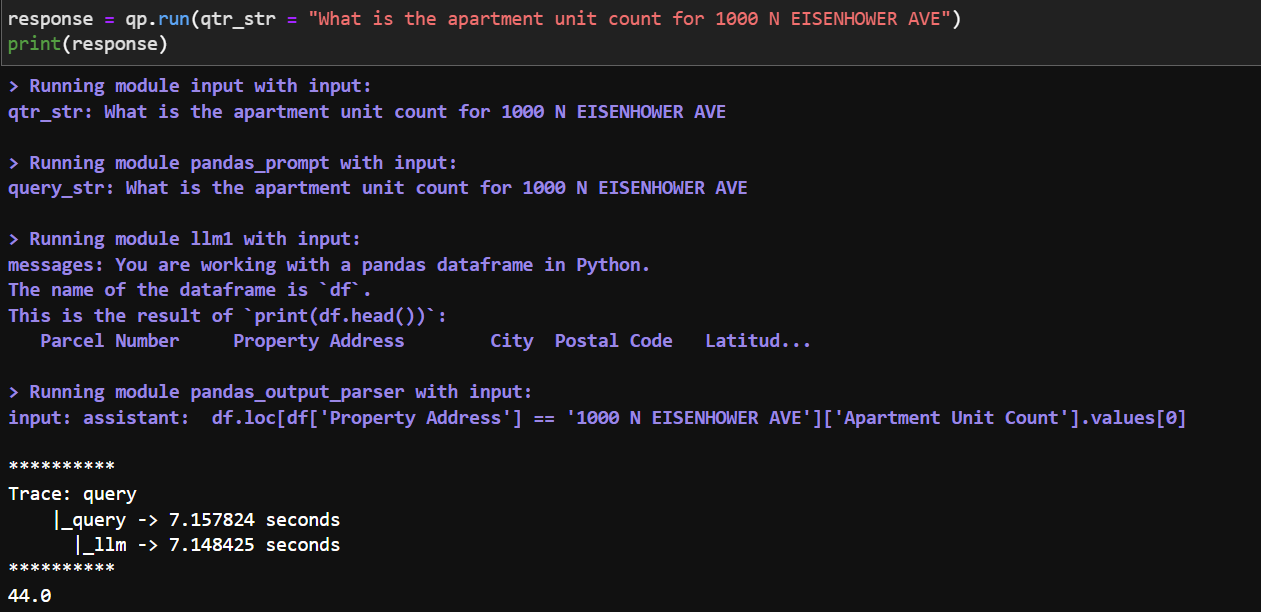
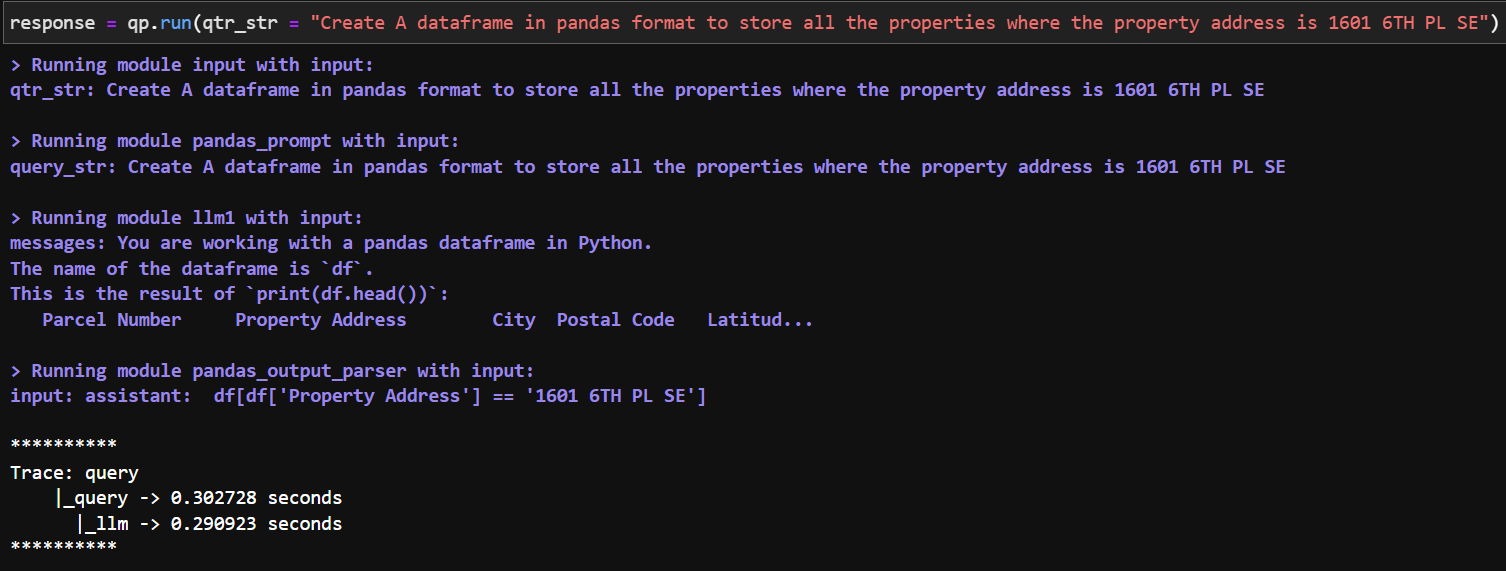
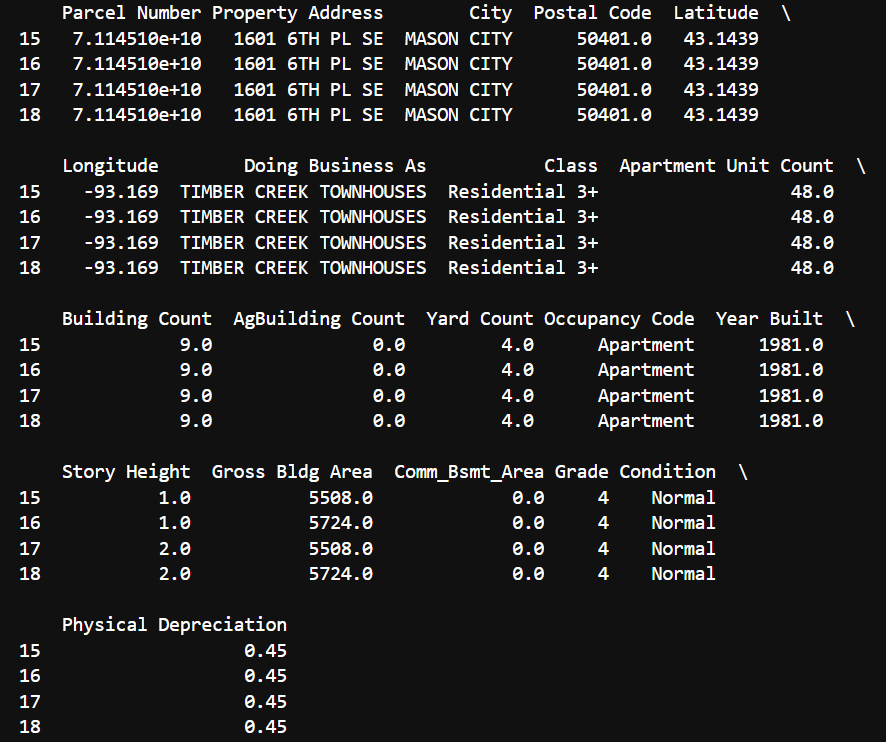
Query Pipeline For Text To Pandas
- Dealing with structured data (.csv, .xlx, etc)
To be Continued:
Applying Prompt Template (Instruction to be parsed) to be Query Pipeline to make sure the dataframe is correctly formatted
Integrate a function calling tool in the query pipeline to call the mapping function which in return will output a map of Iowa to showcase the attributes based on the query of the user
Sources
- Hugging Face Prithvi_100M: Hugging Face Team. (n.d.). IBM-NASA-geospatial/prithvi-100m · hugging face. ibm-nasa-geospatial/Prithvi-100M · Hugging Face. https://huggingface.co/ibm-nasa-geospatial/Prithvi-100M