Week Goals
This week we continued our work in the Community Capitals project and we are specifically still looking into the social and cultural capital measurements and datasets. Our goal this week was to transform raw datasets we collected for the measurements we came up with and transformed them so that we can use it as one of our indicators in the final data visualization web app. We then also looked at couple of other datasets that were already finalized by Solomon and we try to do some data exploratory and visualizations with them.
Social and Cultural Capital Datasets
FBI Crime Reports
We worked with the FBI Crime Reports dataset which consisted all the crimes reported in the year of 2021 for all offenses. There are a total of fifty different offenses in the dataset, but we primarily focused on four which were classified as the most violent crimes:
- Murder: 11(Non-negligent)
- Forcible Rape: 20
- Robbery: 30
- Aggravated Assault: 40
We believed that these four in particular could be a strong measure for social capital. High rates of such crimes might indicate low levels of social cohesion, trust, and mutual aid among community members, which are key components of social capital.
The dataset initially consisted over 78 columns, with a lot of redundant columns but also followed a ‘wide’ format which was very hard to read, especially when trying to see the demographics on who committed the crime.
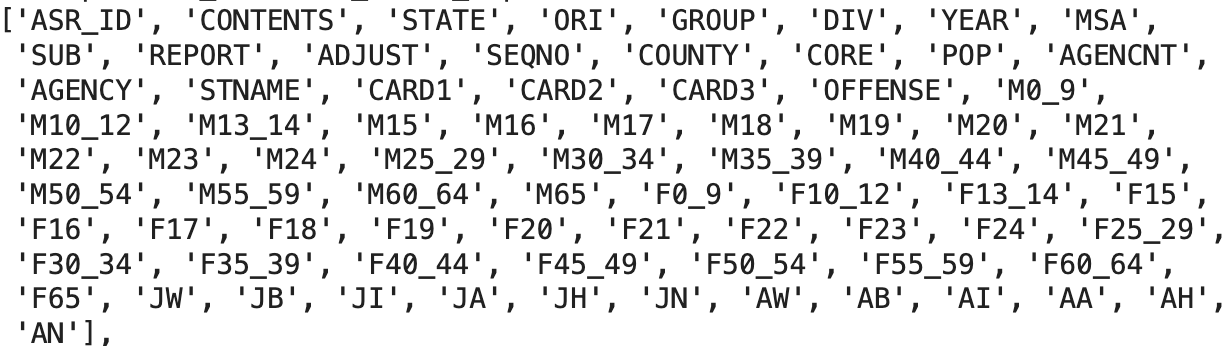
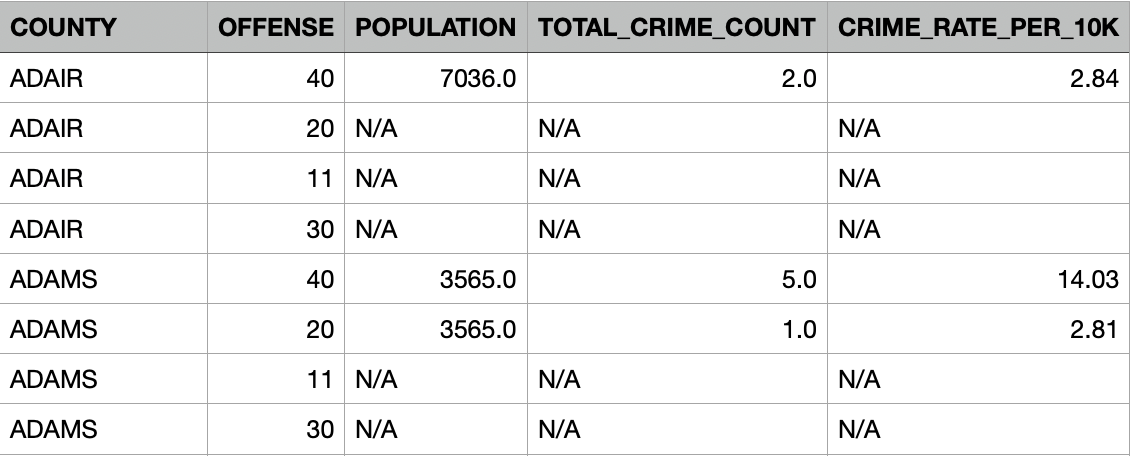
We then transformed this from a wide format to a long format, and we kept the total crime count for each offense in each county, as well as the crime count per 10k population. This way we have much less columns, and we can extract important crime information for each offense in each county much easier.
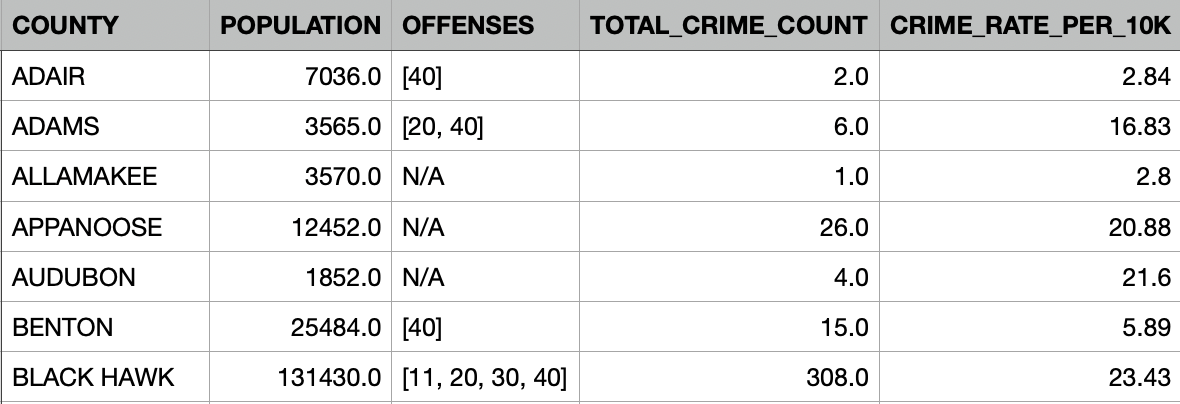
 For most of our datasets, we are trying to follow a format where in each county level dataset we have all the 99 different counties in the ‘COUNTY’ column, this way, it is much easier when merging datasets for our final data visualization.
Social Capital Atlas
Along with the FBI Crime Reports dataset, we looked into Meta’s Social Capital Atlas dataset, a very cool website that shows the social engagement of a community on their social media platform.
Different measures for social capital in this dataset:
- Connectedness: How people with different characteristics and backgrounds are friends with each other, this is a clear example of bridging social capital.
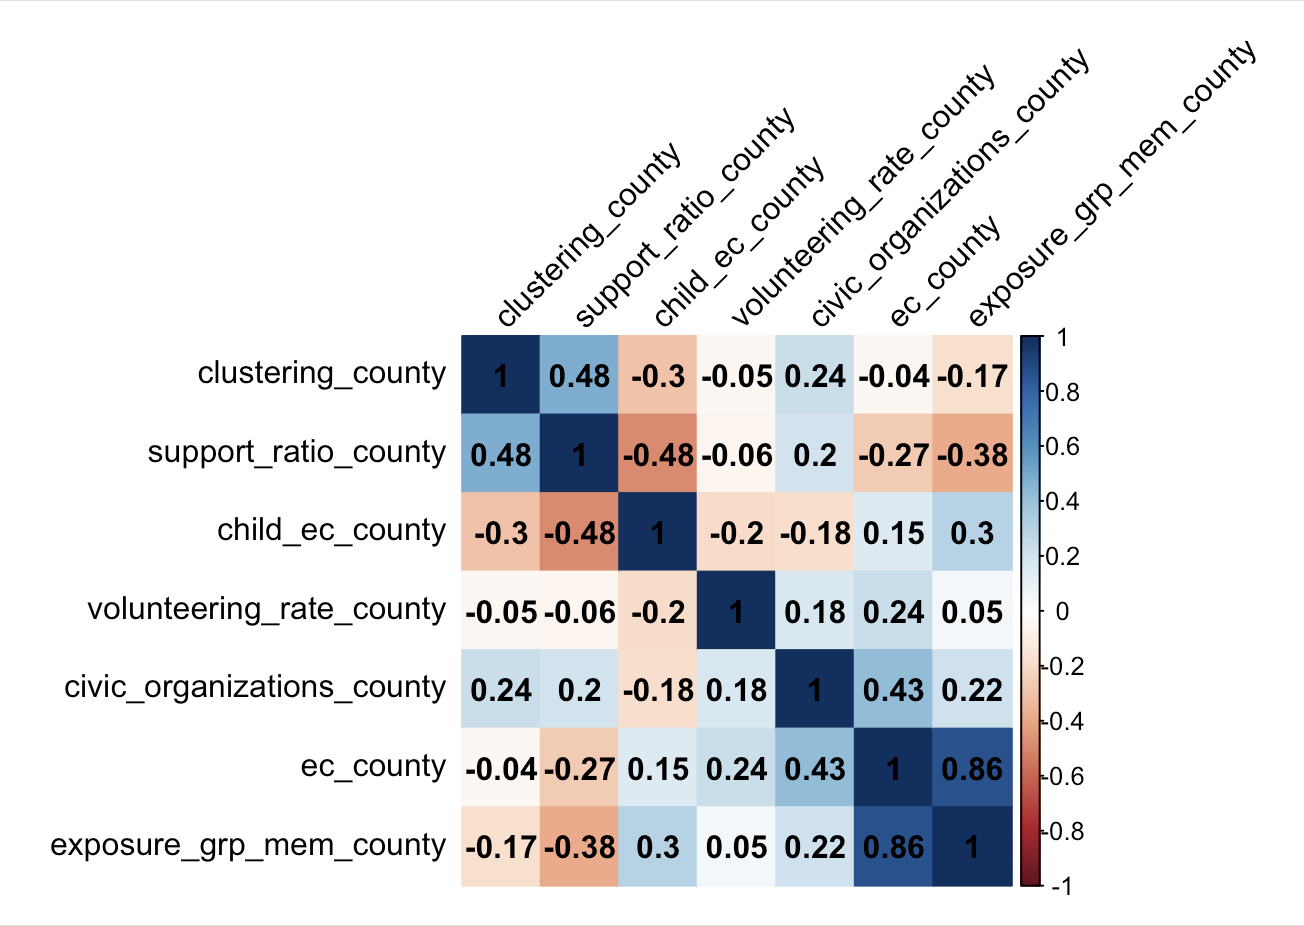
- Cohesiveness: The degree to which friendship networks are clustered into cliques and whether friendships tend to be supported by mutual friends. This includes our clustering and support ratio measures.
- Civic Engagement: Indices of trust or participation in civic organizations. This includes our volunteering rate measure.
Economic Connectedness by County
Next week goal: We have the same dataset but by zip code instead and we would like to generate maps for each variable by zip code.
Iowa Public Library Statistics
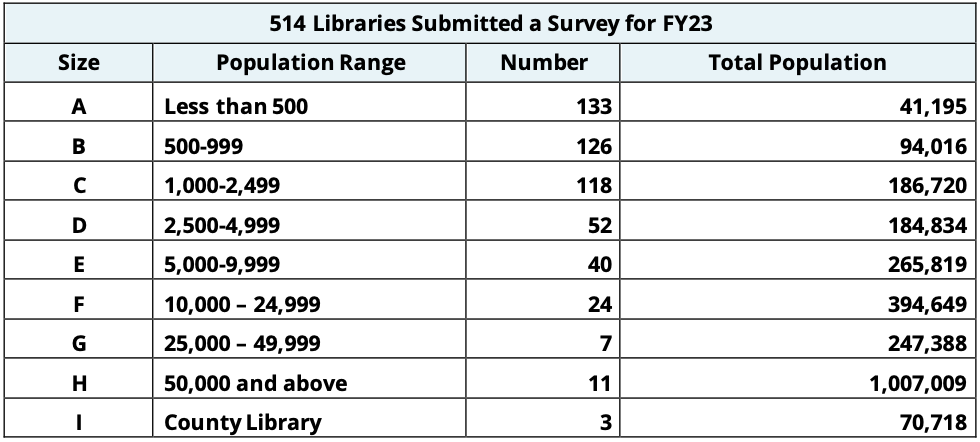
We looked at the Iowa Public Library Statistics for the fiscal year 2023, July 1, 2022 - Jun 30, 2023. There were 514 Libraries in the dataset and each library was set to a size range. The main sections that we looked at were expenditures, programs and activities, services, and transactions. This will tell us how involved a community is to their public library.
Program and Activities
    City  Pop Size Prog1 Attend1 Prog2 Attend2 Prog3 Attend3 Prog4 Attend4 Prog5 Attend5 Prog6 Attend6 Num Programs per 10,000 People Num of Attend per Pop Total Kid Programs Num Kid Programs per 10,000 People Total Kid Programs Attend Num of Kid Programs Attend per 10,000 People
1 Ackley 1699    C     5      28    46    1106     0       0    68     379    12     441   131    1954                       771.0418             1.1500883                 51                          300.17657                      1134                                     6674.514
2  Adair  828    B     0       0     5     245     0       0     1      10     6     150    12     405                       144.9275             0.4891304                  5                           60.38647                       245                                     2958.937
3   Adel 6090    E   143    2638    37     719    33     397   327    1902    35    1635   575    7291                       944.1708             1.1972085                180                          295.56650                      3357                                     5512.315
4 Agency  463    B     0       0    11      56     0       0    12      40     0       0    23      96                       496.7603             0.2073434                 11                          237.58099                        56                                     1209.503
5  Akron 1580    C    40     980    32    1353     4      72    55     407    25     878   156    3690                       987.3418             2.3354430                 72                          455.69620                      2333                                    14765.823
In this table we added columns to find out the number of programs and attendance per 10,000 people in each city. We also looked at just the kid programs. In this dataset kids are classified by the age range 0-5 and 6-11.
Services
    City  Pop Size Visits Visits Per Capita Internet PCs Internet Use Wireless Sessions Website Visits St. Ft. of Building Avg. Weekly Hours Open Visits Per 10,000 People Wireless Sessions Per 10,000 People Website Visits Per 10,000 People
1 Ackley 1699    C  11000          6.474397            4          520              4183           2203                5300                     42                 64743.97                           24620.365                        12966.451
2  Adair  828    B   1582          1.910628            2          146               319            290                3200                     13                 19106.28                            3852.657                         3502.415
3   Adel 6090    E  62001         10.180788            7         1543             11756          22079               18000                     43                101807.88                           19303.777                        36254.516
4 Agency  463    B   1716          3.706263            4           13               966            612                 357                     43                 37062.63                           20863.931                        13218.143
5  Akron 1580    C  18342         11.608861            5          802              2076           2747                2412                     43                116088.61                           13139.241                        17386.076
In this table we were interested in the services that a library had for their community. We calculated the visits, wireless sessions, and website visits per 10,000 people.
2022 General Election Turnout
In the General Election Turnout dataset we were given information about election day, absentee, and active voters in Iowa counties.
Election Turnout
     County   Pop Election Day Voters Absentee Voters Total Voters Active Voters as of 11/8/2022 % Active Voter Turnout Inactive Voters as of 11/8/2022 % Total Voter Turnout % Total Absentee Voters Total Voters per 10,000 people Active Voters per 10,000 people Election Day Voters per 10,000 people Absentee Voters per 10,000 people
1     Adair  7479                2249             943         3192                          4707                 0.6781                             719                0.5882               0.2954261                       4267.950                        6293.622                              3007.087                          1260.864
2     Adams  3680                1142             538         1680                          2446                 0.6868                             378                0.5949               0.3202381                       4565.217                        6646.739                              3103.261                          1461.957
3 Allamakee 14046                3935            1915         5850                          8423                 0.6945                            1424                0.5940               0.3273504                       4164.887                        5996.725                              2801.509                          1363.377
4 Appanoose 12279                3416            1319         4735                          7434                 0.6369                            1450                0.5329               0.2785639                       3856.177                        6054.239                              2781.986                          1074.192
5   Audubon  5651                1746             739         2485                          3691                 0.6732                             529                0.5888               0.2973843                       4397.452                        6531.587                              3089.719                          1307.733
In this table we calculated the total amount of voters per 10,000 people in each county. We also calculated the election day, absentee, and active voters per 10,000 people in each county.
Exploration of Arts, Events, and Race
We started to explore the dataset about art, events, and race in Iowa cities.
These two plots show you the relationship between the city population and the Historic Sites that are less than 100.
Map Exploration
This interactive map shows cities in Iowa with less than 100 historic sites per 10,000 people.

Ancestry
Art Sites
Historic Sites
Museums
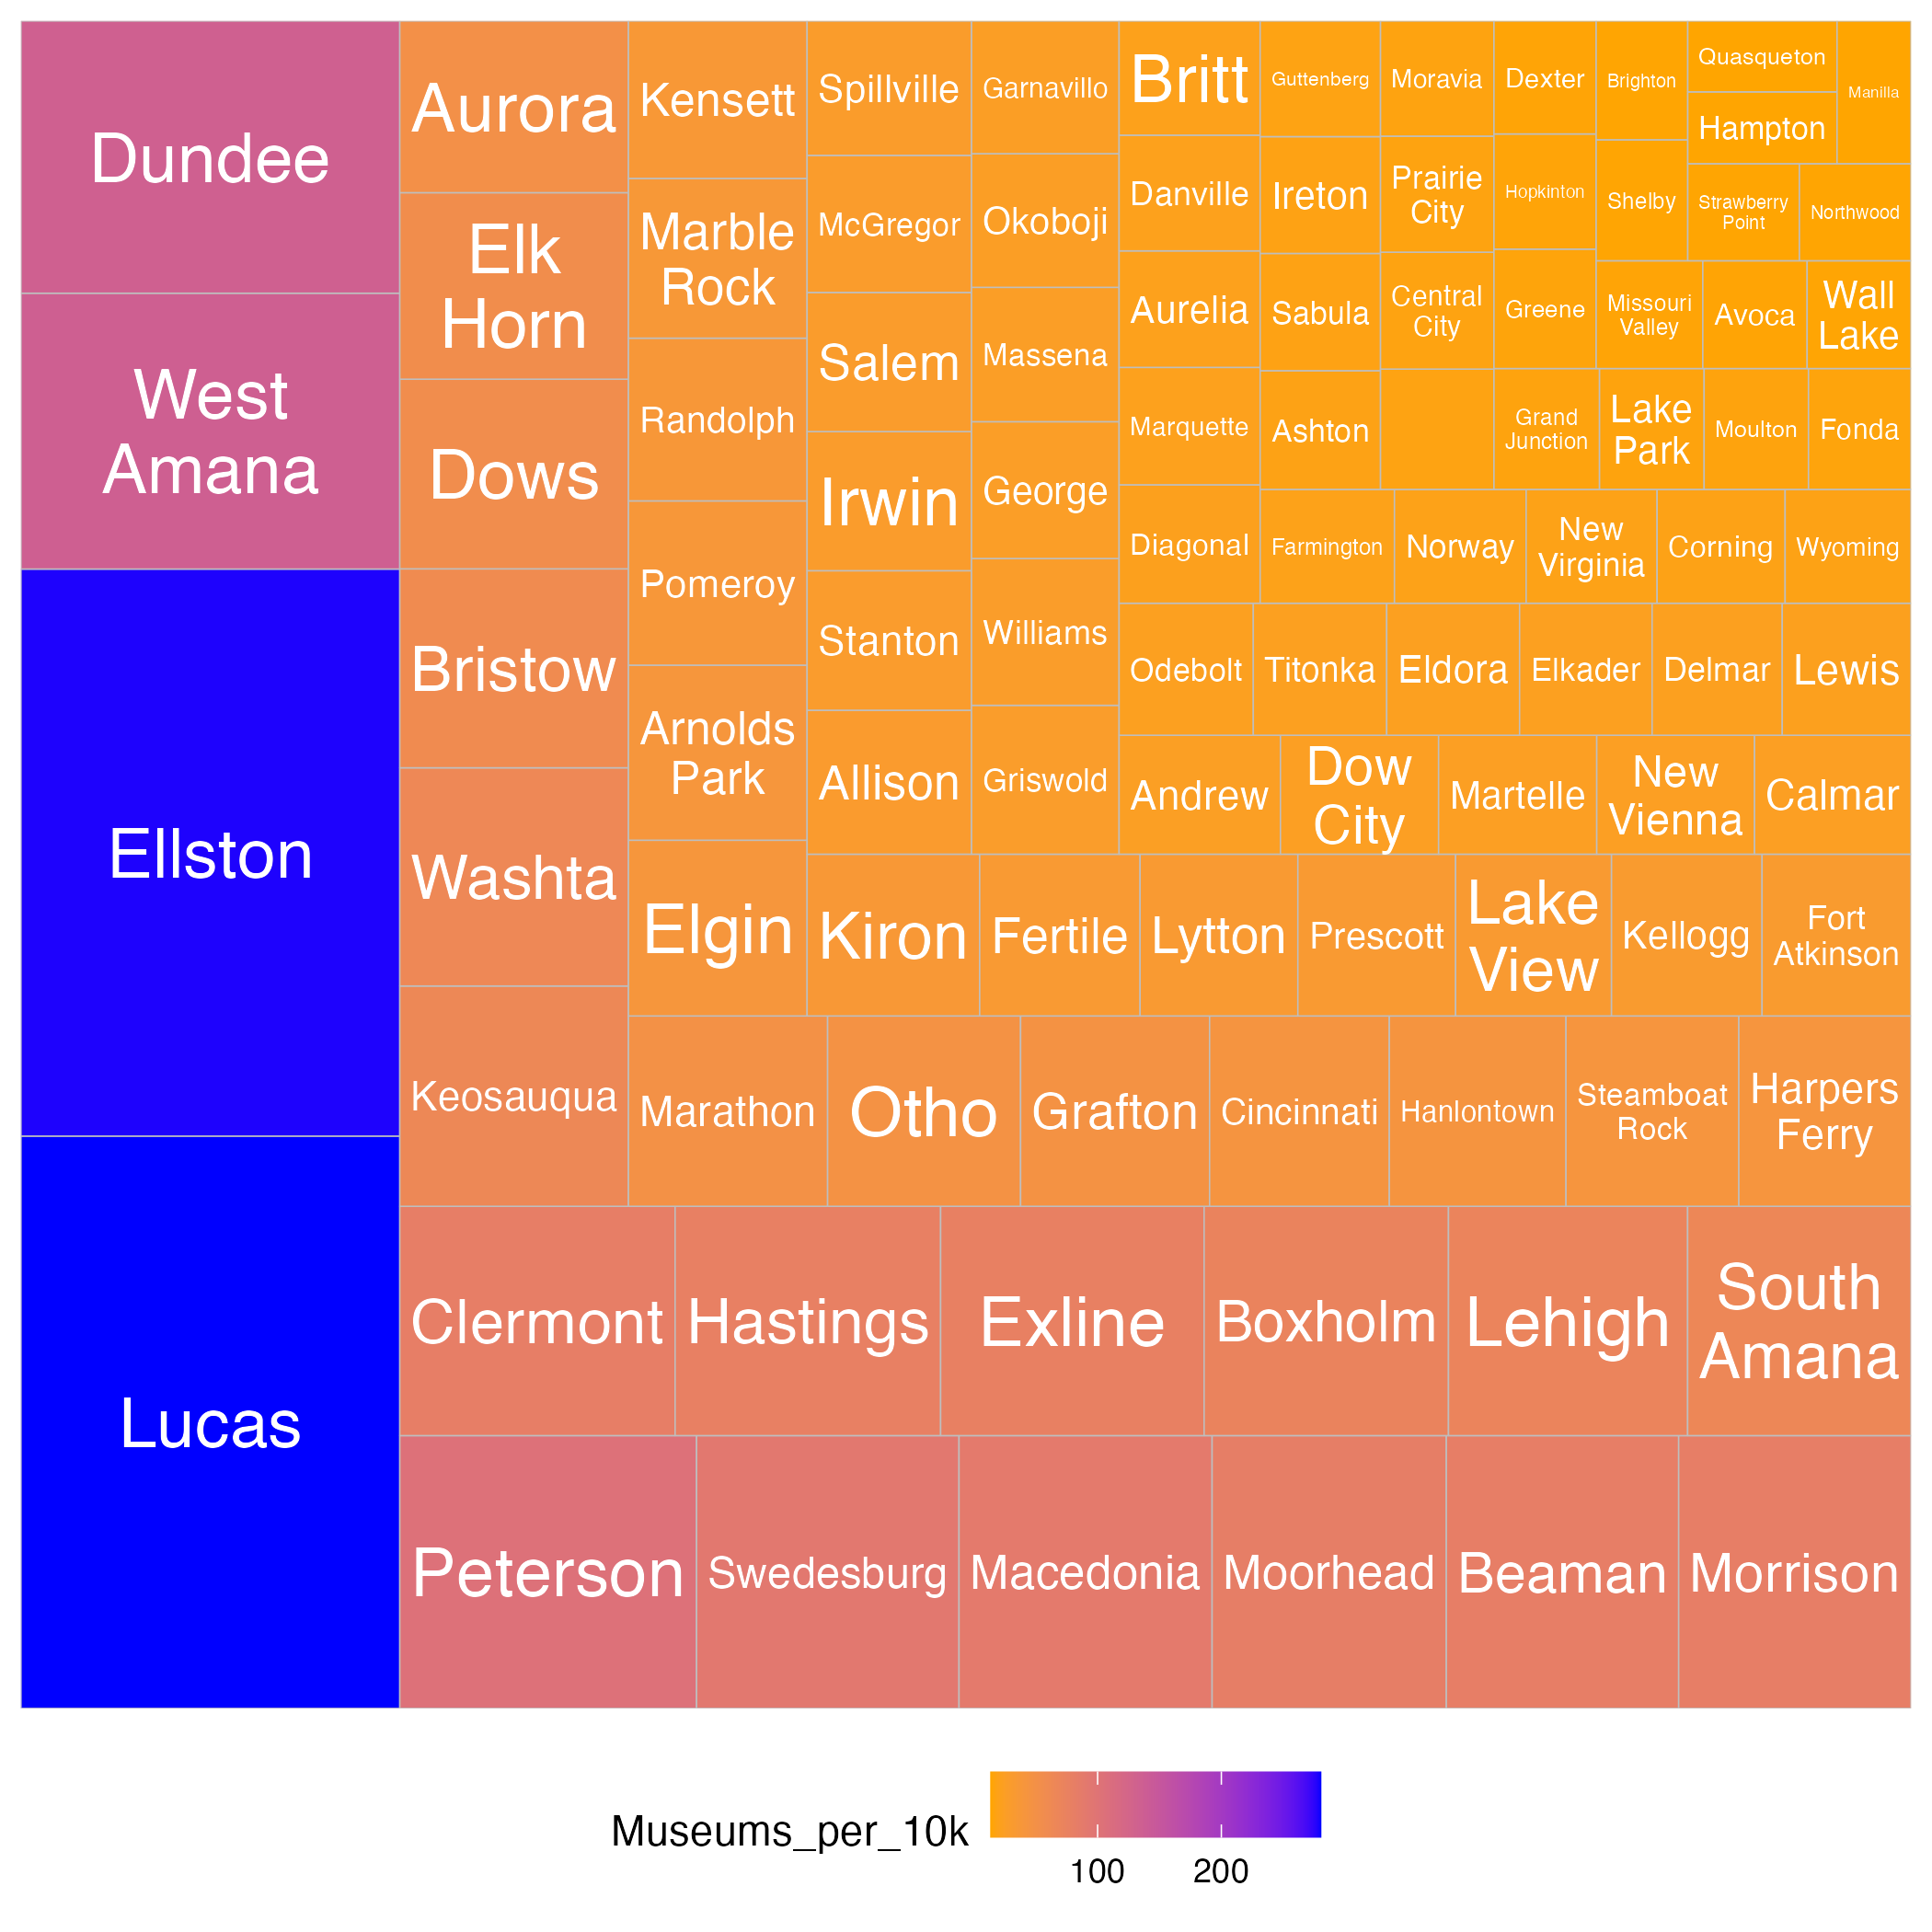
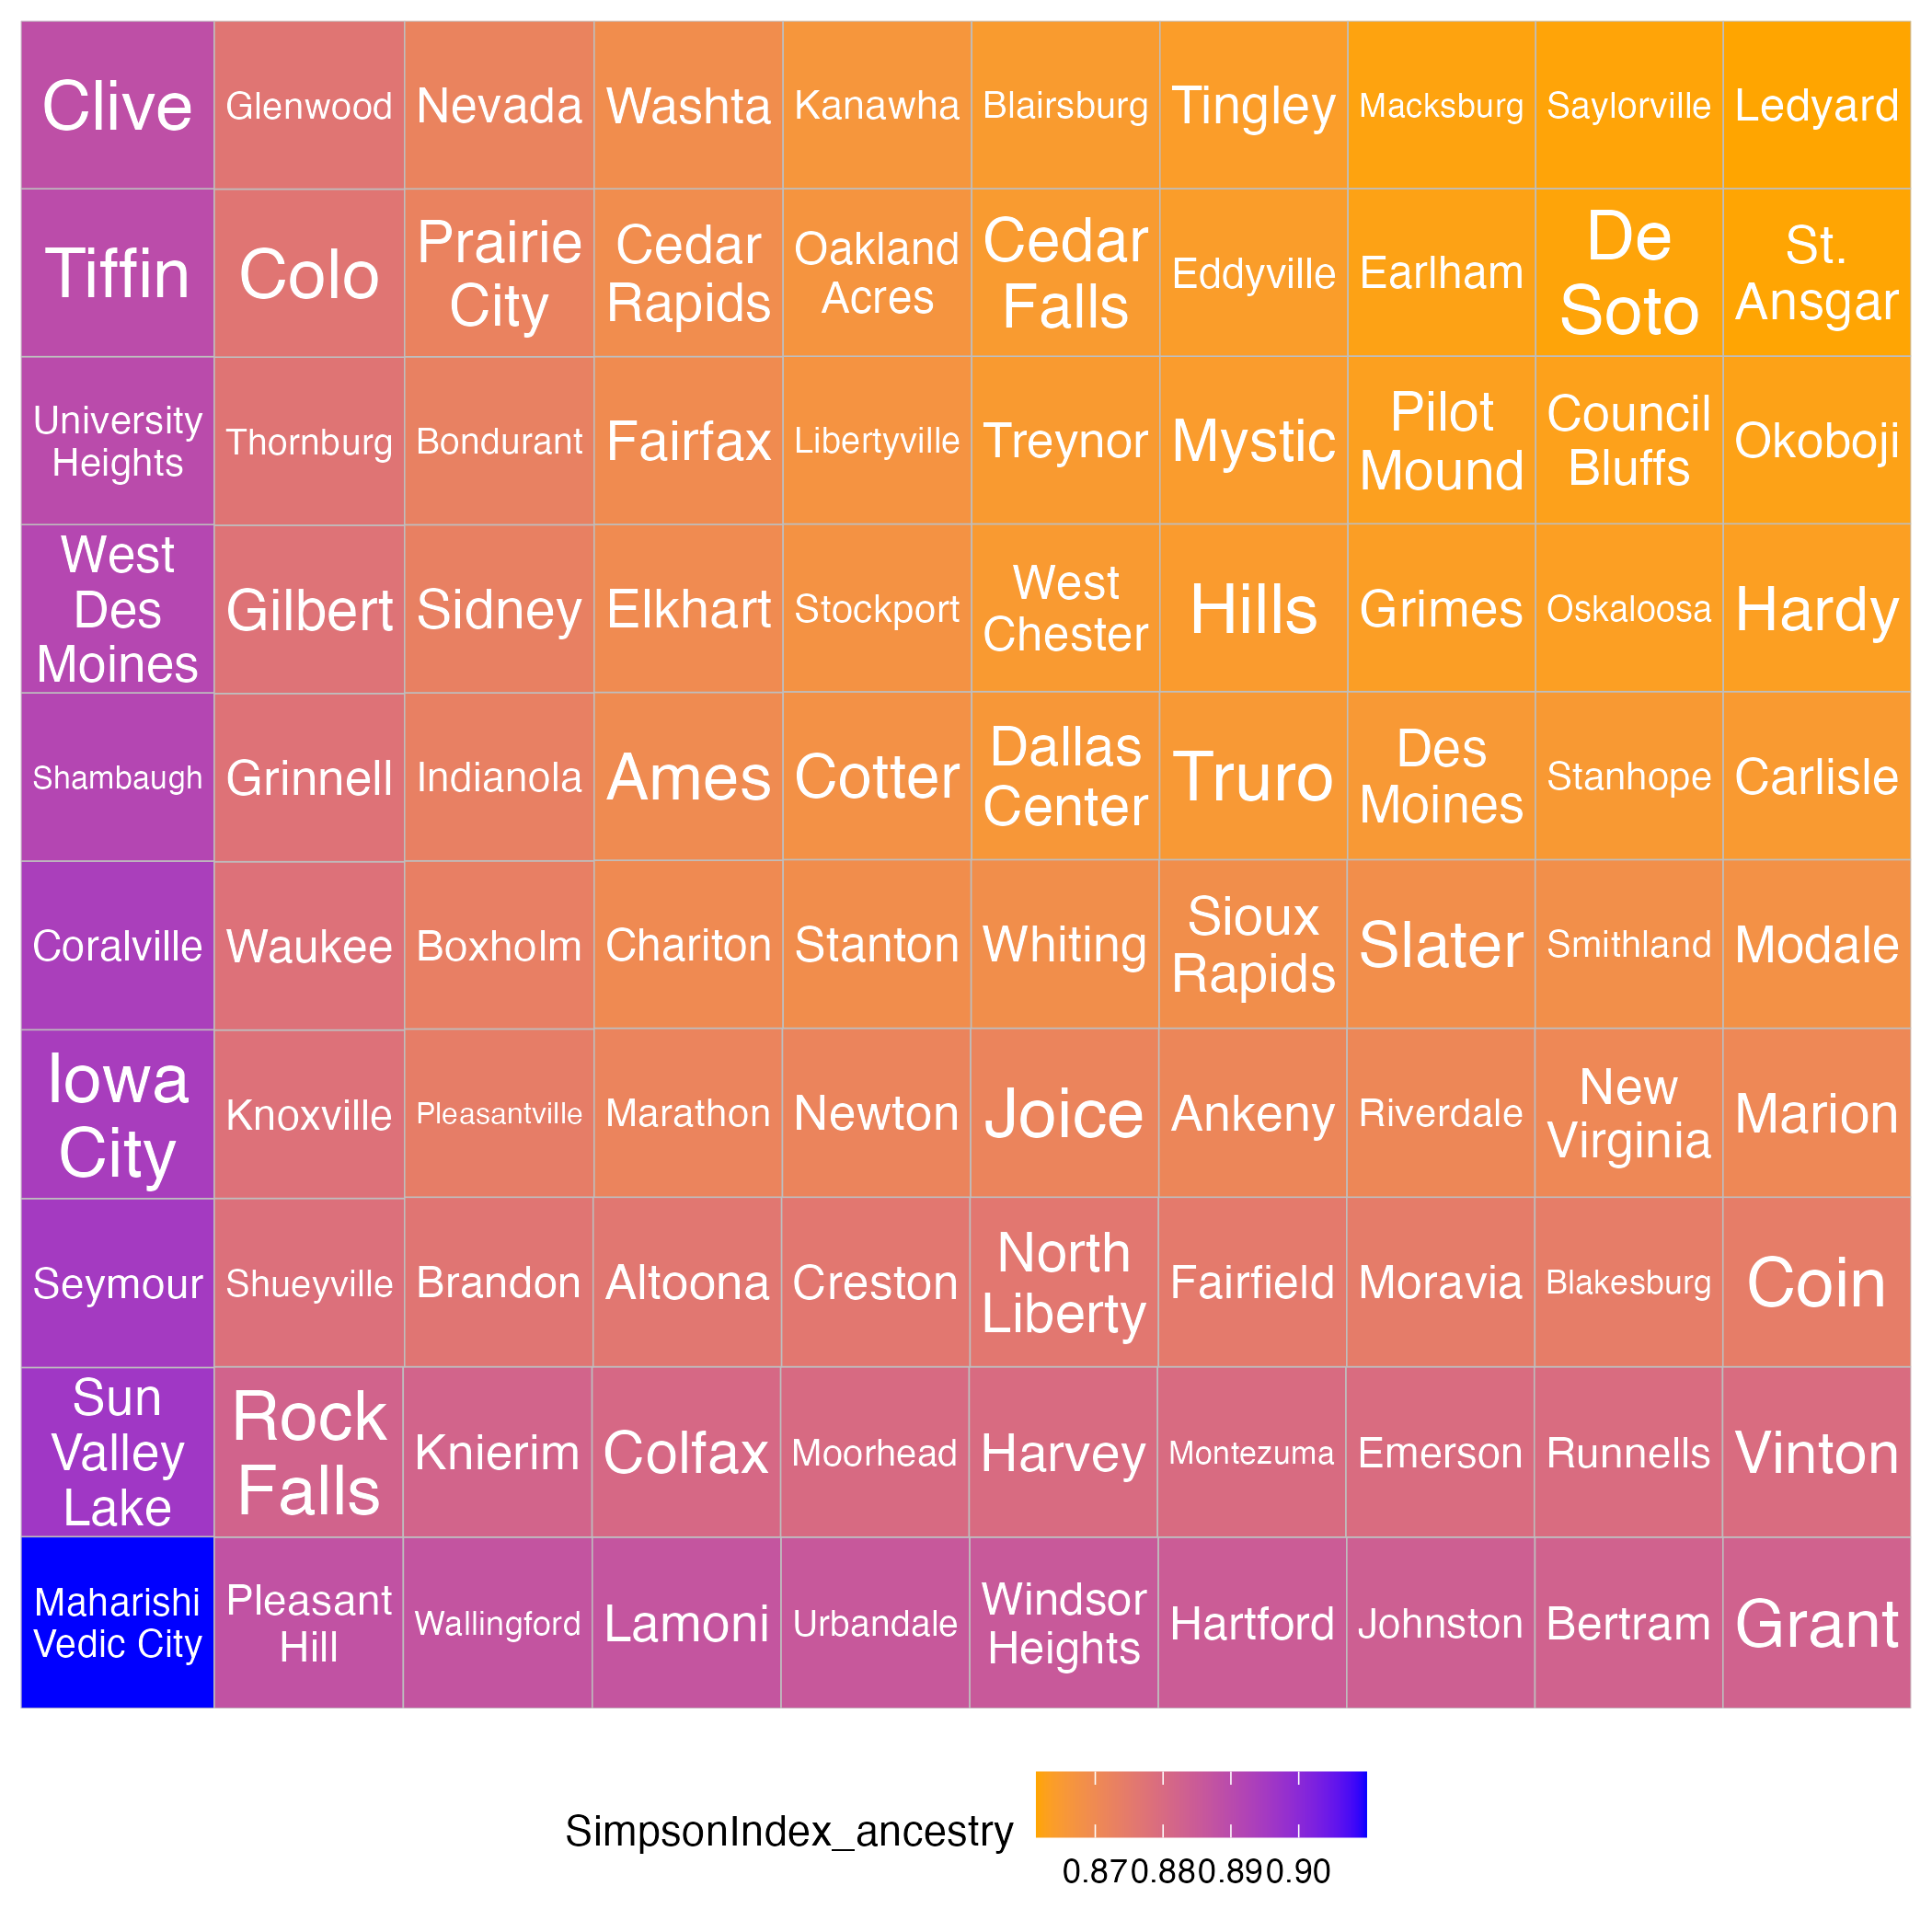
This image shows 100 cities in Iowa with the highest race Simpson Index.
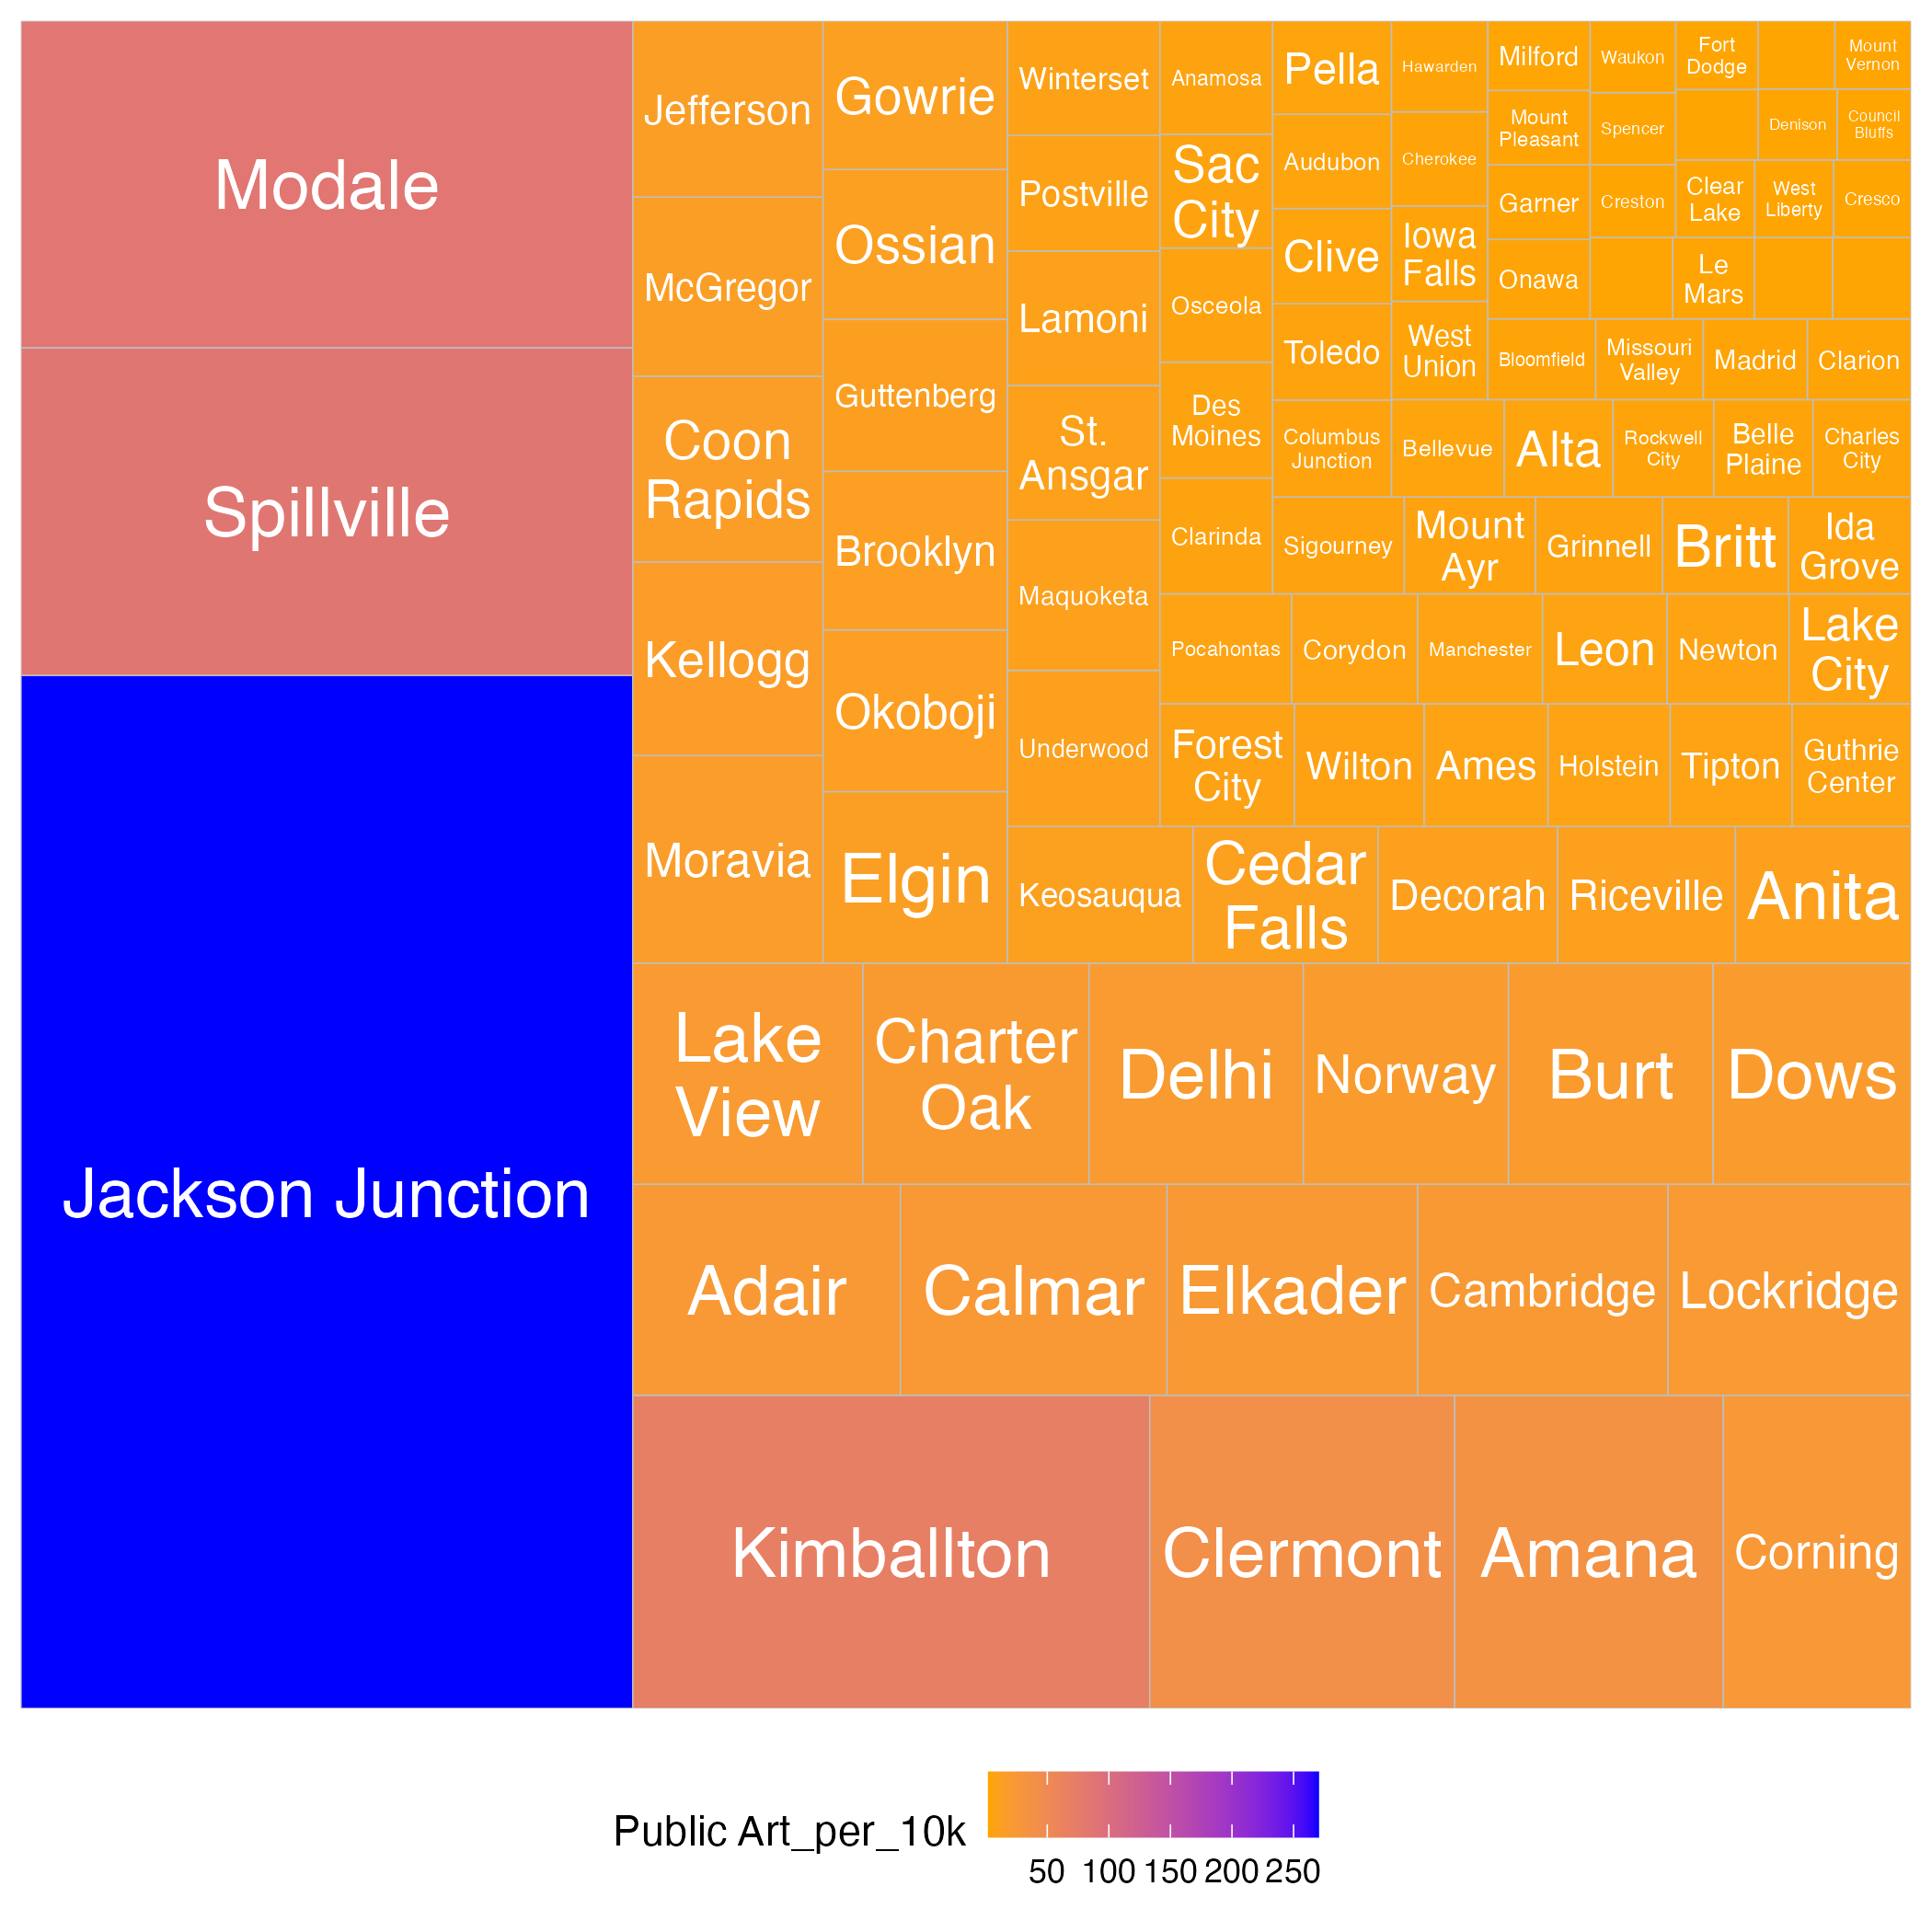
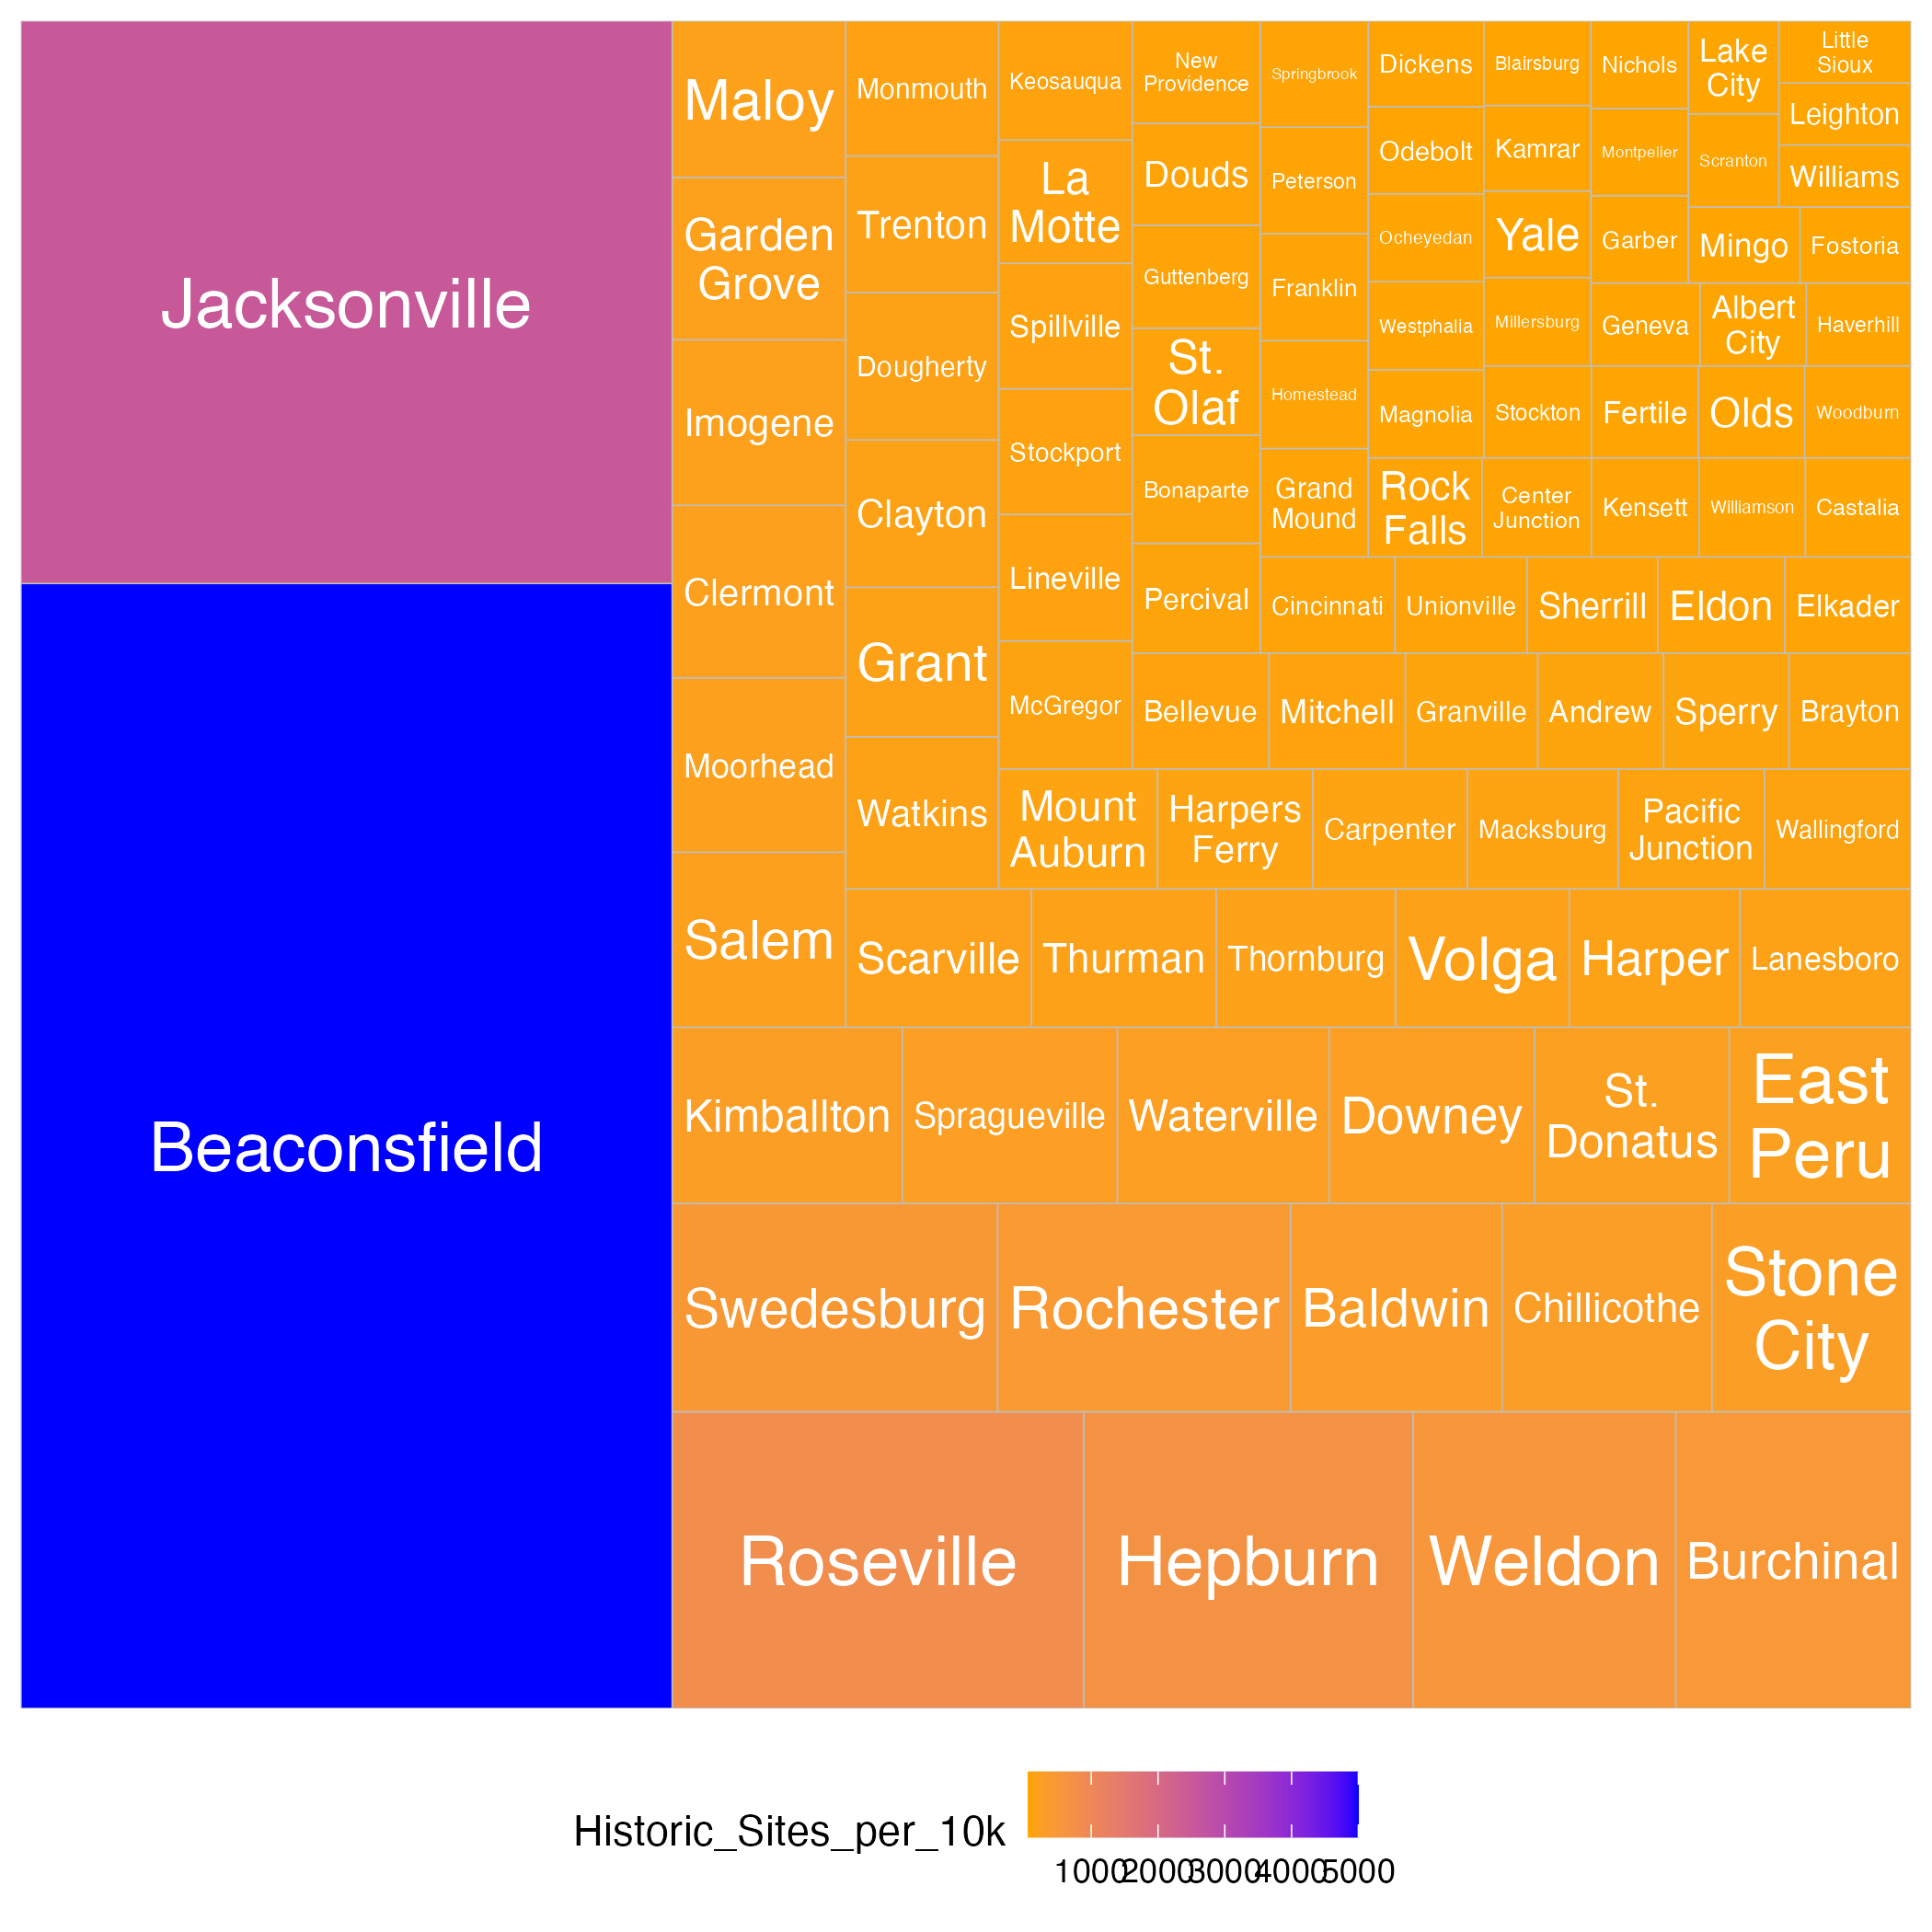
These treemaps show 100 cities in Iowa that have the highest Simpson Index race and ancestry, art sites, historic sites, and museums.
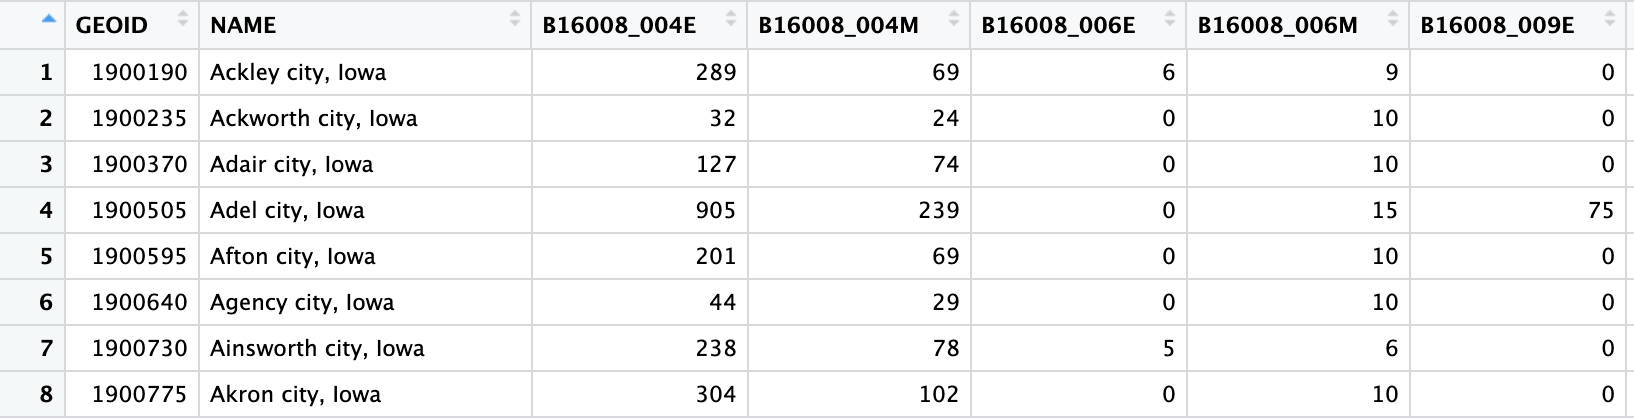
3 ACS Datasets
Single Household Distribution across Cities
We started by collecting single household datasets from ACS
    GEOID                NAME B11003_010E B11003_010M B11003_016E B11003_016M
1 1900190   Ackley city, Iowa          10           9          41          28
2 1900235 Ackworth city, Iowa           0          10           8           8
3 1900370    Adair city, Iowa           0          10           8           9
4 1900505     Adel city, Iowa           0          15          61          73
5 1900595    Afton city, Iowa           1           3          15          12
6 1900640   Agency city, Iowa           0          10          22          24
Because of population differences between cities, we fetched the total number of households within cities from ACS and calculated proportions of single households in cities.
    GEOID     CITY B11003_010E B11003_010M B11003_016E B11003_016M estimate proportion_male proportion_female
1 1900190   Ackley          10           9          41          28      413     0.024213075        0.09927361
2 1900235 Ackworth           0          10           8           8       32     0.000000000        0.25000000
3 1900370    Adair           0          10           8           9      185     0.000000000        0.04324324
4 1900505     Adel           0          15          61          73     1525     0.000000000        0.04000000
5 1900595    Afton           1           3          15          12      245     0.004081633        0.06122449
6 1900640   Agency           0          10          22          24      135     0.000000000        0.16296296
Commuting Time to Work
From a bunch of datasets for means of transportations from ACS, we collected the dataset of people commuting to work over one hour every day.
    GEOID                NAME   variable num_commuters moe
1 1900190   Ackley city, Iowa B08134_010            29  21
2 1900235 Ackworth city, Iowa B08134_010             0  10
3 1900370    Adair city, Iowa B08134_010            34  24
4 1900505     Adel city, Iowa B08134_010            23  35
5 1900595    Afton city, Iowa B08134_010            35  24
6 1900640   Agency city, Iowa B08134_010             2   4
Also because of the size differences, I collectd the total number of communters and then calculated the proportion of people commuting more than 1 hour to work.
    GEOID     CITY   variable num_commuters moe estimate  proportion
1 1900190   Ackley B08134_010            29  21      752 0.038563830
2 1900235 Ackworth B08134_010             0  10       50 0.000000000
3 1900370    Adair B08134_010            34  24      390 0.087179487
4 1900505     Adel B08134_010            23  35     2674 0.008601346
5 1900595    Afton B08134_010            35  24      500 0.070000000
6 1900640   Agency B08134_010             2   4      199 0.010050251
English Proficiency Dataset
English proficiency also contributes to how society is established, expresses and communicates ideas.
 Also, to maintain good relativity to the city sizes, I calculate the proportions.
      CITY proportion
1   Ackley  0.9660912
2 Ackworth  1.0000000
3    Adair  1.0000000
4     Adel  0.9799023
5    Afton  0.9630332
6   Agency  1.0000000
Merge Datasets together
These three datasets will be valuable to measurer the social capitals at the end and we just care about the proportions. So I perform a merge.
Race & Ancestry Diversity Dataset
Race and Ancestry are important measures for Cultural Capitals. I collected data about number of people with different races and ancestries within cities and merge them together.
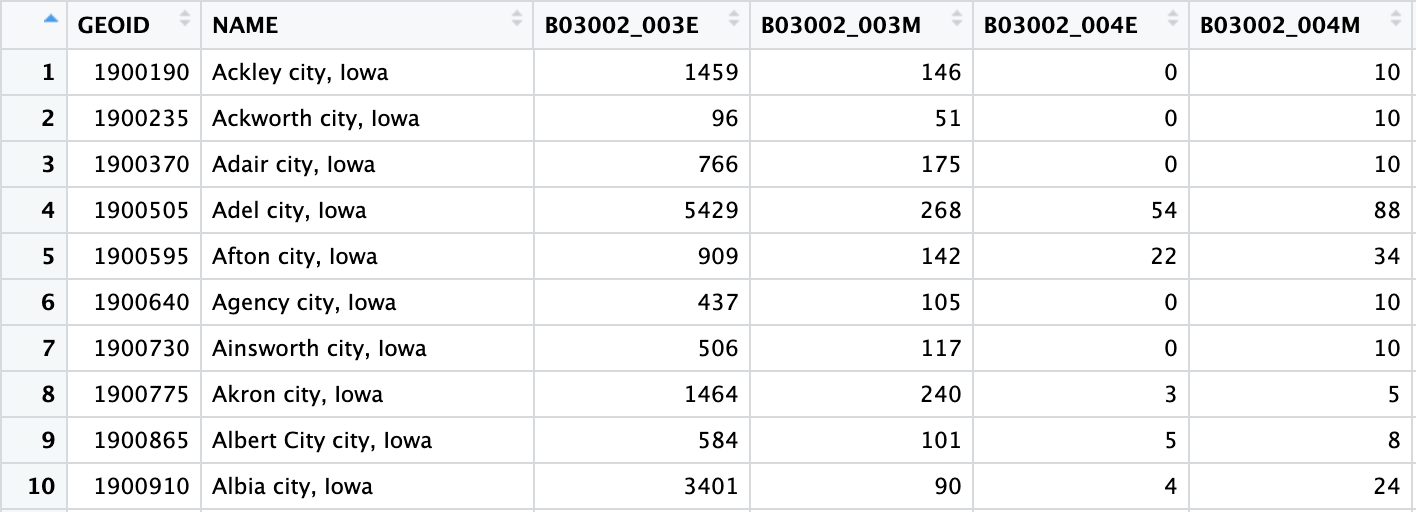 We then use Simpson Index to calculate the diversity within each city.
    GEOID     CITY SimpsonIndex_race SimpsonIndex_ancestry
1 1900190   Ackley        0.24674401             0.8196178
2 1900235 Ackworth        0.17250674             0.8134410
3 1900370    Adair        0.09779811             0.7921790
4 1900505     Adel        0.17635778             0.8601441
5 1900595    Afton        0.26618045             0.8464086
6 1900640   Agency        0.08874089             0.8409283
Cultural Datasets
We process to some visualizations for some of the measures for cultural capitals
Social and Cultural Capital Datasets
FBI Crime Reports
We worked with the FBI Crime Reports dataset which consisted all the crimes reported in the year of 2021 for all offenses. There are a total of fifty different offenses in the dataset, but we primarily focused on four which were classified as the most violent crimes:
We believed that these four in particular could be a strong measure for social capital. High rates of such crimes might indicate low levels of social cohesion, trust, and mutual aid among community members, which are key components of social capital.
The dataset initially consisted over 78 columns, with a lot of redundant columns but also followed a ‘wide’ format which was very hard to read, especially when trying to see the demographics on who committed the crime.
We then transformed this from a wide format to a long format, and we kept the total crime count for each offense in each county, as well as the crime count per 10k population. This way we have much less columns, and we can extract important crime information for each offense in each county much easier.
Social Capital Atlas
Along with the FBI Crime Reports dataset, we looked into Meta’s Social Capital Atlas dataset, a very cool website that shows the social engagement of a community on their social media platform.
Different measures for social capital in this dataset:
Economic Connectedness by County
Next week goal: We have the same dataset but by zip code instead and we would like to generate maps for each variable by zip code.
Iowa Public Library Statistics
We looked at the Iowa Public Library Statistics for the fiscal year 2023, July 1, 2022 - Jun 30, 2023. There were 514 Libraries in the dataset and each library was set to a size range. The main sections that we looked at were expenditures, programs and activities, services, and transactions. This will tell us how involved a community is to their public library.
Program and Activities
In this table we added columns to find out the number of programs and attendance per 10,000 people in each city. We also looked at just the kid programs. In this dataset kids are classified by the age range 0-5 and 6-11.
Services
In this table we were interested in the services that a library had for their community. We calculated the visits, wireless sessions, and website visits per 10,000 people.
2022 General Election Turnout
In the General Election Turnout dataset we were given information about election day, absentee, and active voters in Iowa counties.
Election Turnout
In this table we calculated the total amount of voters per 10,000 people in each county. We also calculated the election day, absentee, and active voters per 10,000 people in each county.
Exploration of Arts, Events, and Race
We started to explore the dataset about art, events, and race in Iowa cities.
These two plots show you the relationship between the city population and the Historic Sites that are less than 100.
Map Exploration
This interactive map shows cities in Iowa with less than 100 historic sites per 10,000 people.
![](imgs/Public_art_less.html{width=“600” height=“400”}
This interactive map shows cities in Iowa with less than 100 public art per 10,000 people.
Race
Ancestry
Art Sites
Historic Sites
Museums
This image shows 100 cities in Iowa with the highest race Simpson Index.
These treemaps show 100 cities in Iowa that have the highest Simpson Index race and ancestry, art sites, historic sites, and museums.
3 ACS Datasets
Single Household Distribution across Cities
We started by collecting single household datasets from ACS
Because of population differences between cities, we fetched the total number of households within cities from ACS and calculated proportions of single households in cities.
Commuting Time to Work
From a bunch of datasets for means of transportations from ACS, we collected the dataset of people commuting to work over one hour every day.
Also because of the size differences, I collectd the total number of communters and then calculated the proportion of people commuting more than 1 hour to work.
English Proficiency Dataset
English proficiency also contributes to how society is established, expresses and communicates ideas.
Merge Datasets together
These three datasets will be valuable to measurer the social capitals at the end and we just care about the proportions. So I perform a merge.
Race & Ancestry Diversity Dataset
Race and Ancestry are important measures for Cultural Capitals. I collected data about number of people with different races and ancestries within cities and merge them together.
Cultural Datasets
We process to some visualizations for some of the measures for cultural capitals
Visualizations
Historic Sites
Arts
Museums
Monuments