Demographic Analysis
Housing Affordability

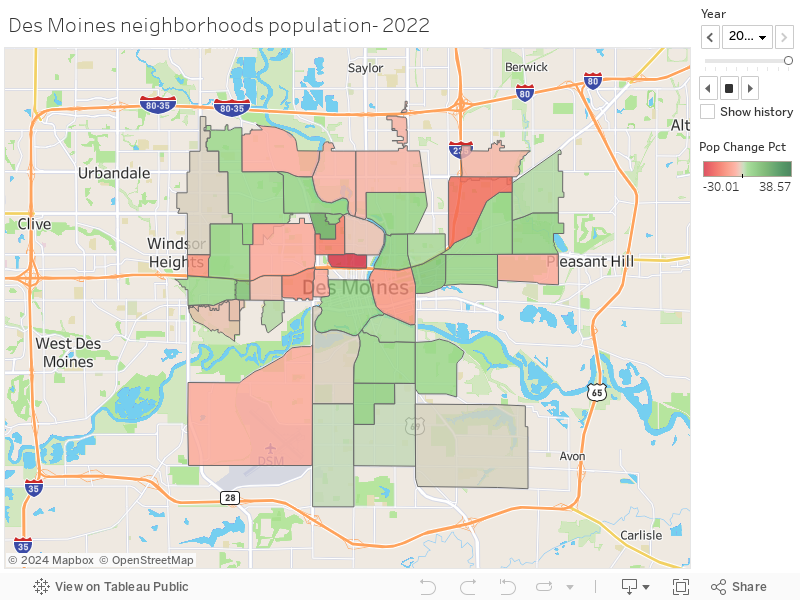
When we plot the three areas together we can start to see some small trends. It appears that Des Moines is getting more affordable while the suburbs of Des Moines are getting more expensive. .
Supply and demand of Johnston

When analyzing a cities housing market it is useful to observe if the city is issuing the correct amount of new dwelling permits. We can track vacancies as a good metric to see if the city is oversupplying the market or not.
The Effects of Living In (or Near) an Urban Center
Background:
Iowa is not a MONOLITH. It is crucial to understand the unique characteristics of different areas in order to find solutions that work for a multitude of different communities. First we must find these differences.
Hypothesis:
-
Urban centers, and cities in close proximity to urban centers, will have a higher level of economic burden from housing prices, a lower median age, and a higher median gross rent.

Methodology
- Gather demographic/economic data from the ACS
- Find and map Metropolitan Statistical Area Centers
- Includes Council Bluffs
- Create a 30-mile buffer zone around the MSA Centers in ArcGIS Pro
- Average one-way U.S. commute time: 27.6 minutes
- Join appropriate datasets together for analysis
- Perform necessary calculations
- Analyze and map
Inside buffer zone
- Higher median gross rents
- Lower median ages
- Higher median populations
- Higher incomes
- Equal median housing costs as a percentage of median income


Median Age
- Larger dots = higher median age
- Lower median ages in urban areas
- Clustering of higher median ages along Minnesota border?
- Why?

Median Income
- Larger dots = higher median income
- Higher median incomes in urban areas
- Vertical line through center of state with higher median incomes
- I-35
Do they have a higher median income because they are on the interstate, or does having a higher income make it more likely for an interstate to be built in that area? Both?

Median Gross Rent
- Larger dots = higher median gross rent
- Des Moines, Cedar Rapids, Davenport, and Iowa City Areas have higher rents
- Small towns have low rents
- How strong is the relationship between population size and rent prices?

Housing Burden
- For selected cities
- About equal for inside and outside the buffer zone
- 16% vs. 16.4%
- About even across the state
- Hypothesis was false
- Haven’t accounted for other costs
Looking at income in Iowa
Rent versus Income

This scatterplot shows that there is a weak correlation between rent and income in Iowa.

This screenshot of a GIS map displays the function of rent over income by census tract in Iowa, with one noticeable dark purple county distracting from the fact that most counties in Iowa have less than 30 percent of income spent on annual rent.

When one zooms in to the counties with more than 40 percent of income being spent on rent, it is apparent that the commonality between these census tracts is that they all contain a college or university.

This is a scatterplot that displays rent versus commute time, with a clear negative correlation between the two. However, there is some disparity when commute time is lower, as rent is more disparate there.

This GIS map of rent over commute time further confirms that rent tends to decrease as commute time increases. Further research will be done to see how gas costs affect affordability of living further from an urban center.

While the general trend for Iowa is that a greater commute correlates with lower rent, the opposite is true in Des Moines. There is a clear correlation between longer commute times and higher rent in Des Moines.
Have a good day.