import requests
import csv
import json

def api_to_csv(api_url, csv_filename):
    # Fetch data from the API
    response = requests.get(api_url)
    response.raise_for_status()  # Check for request errors
    data = response.json()

    # Extract the header
    headers = data[0]

    # Write data to CSV
    with open(csv_filename, 'w', newline='', encoding='utf-8') as csv_file:
        writer = csv.writer(csv_file)
        writer.writerow(headers)
        writer.writerows(data[1:])

# Example usage
api_url = "https://api.census.gov/data/2022/acs/acs5?get=group(B08018)&ucgid=pseudo(0400000US19$1500000)"
csv_filename = "ACS5Y(Places of Work).csv"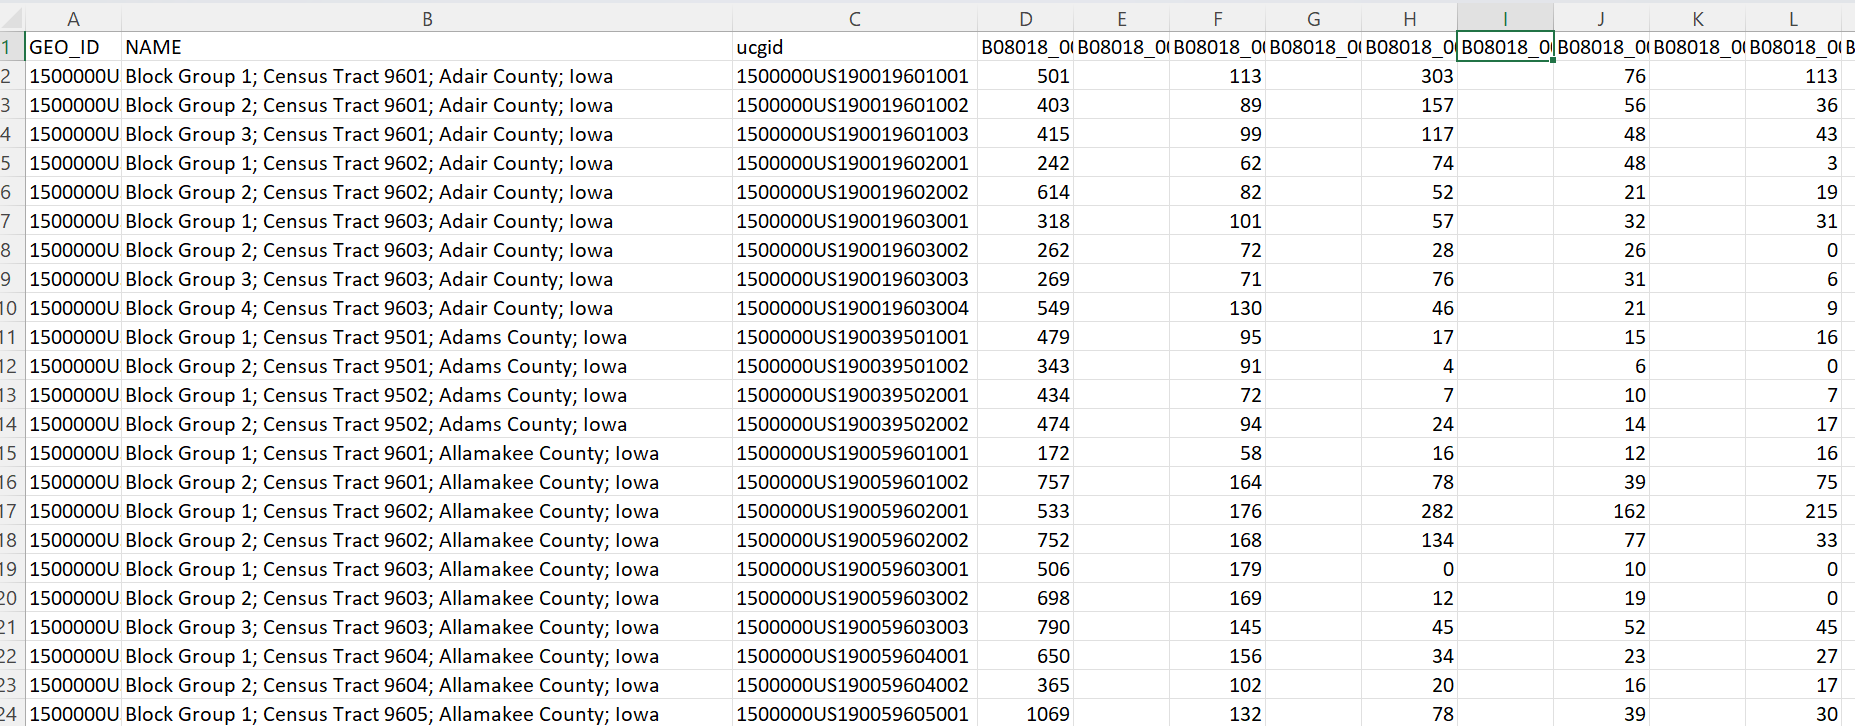
api_to_csv(api_url, csv_filename)Converting API to CSV File
- To help ease converting API of any ACS data into a csv file before integrating them into the Chat Engine
- Have a wide variety of datasets to tackle our topic of interest
Llamaindex & Chat Engine
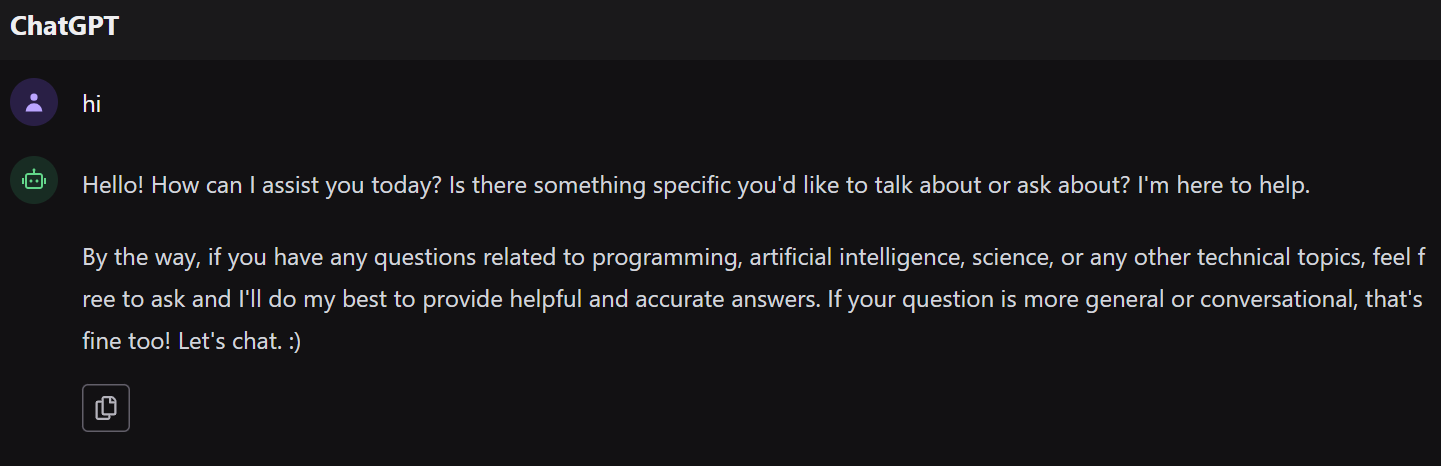
We started working on integrating Llamaindex into the web interface and testing out several of the capabilities of the Chat Engine
Simple User Greeting
Addressing User’s General Query

At this moment, I am still working on fine-tuning the ability of the chat engine to locate the right datasets (Both structured and unstructure data) and provide the accurate output to the user (Perform pandas operations, perform mapping function, etc.)
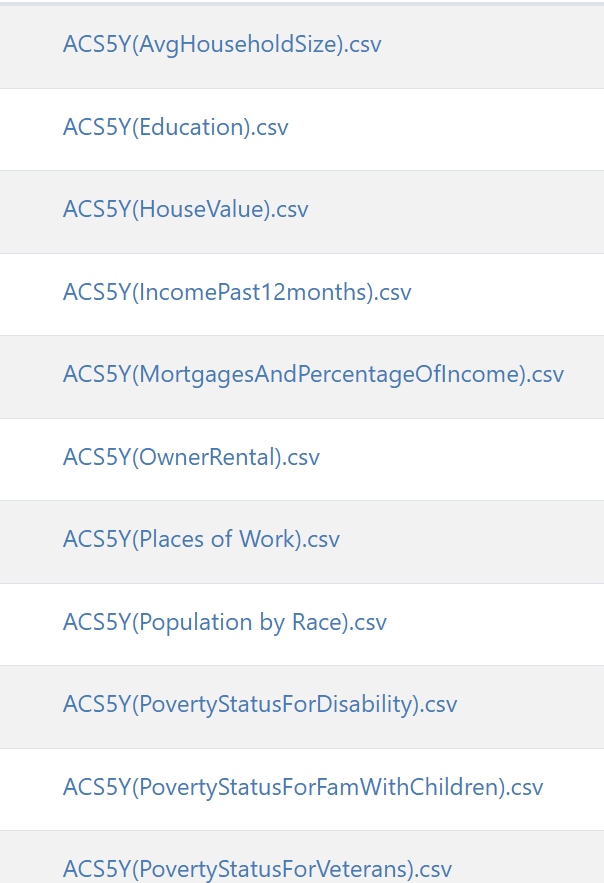
Sourcing for more ACS datasets (Structured Data) to be integrated into the system so that the chat engine is able to address a wider range of topics
Data Visualizatation
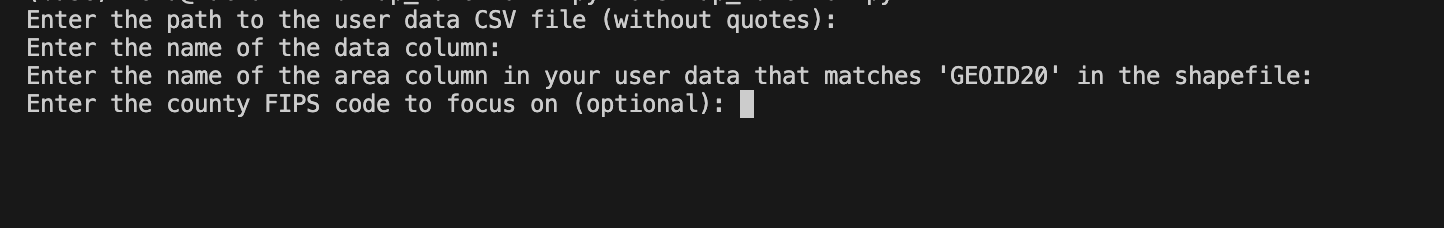
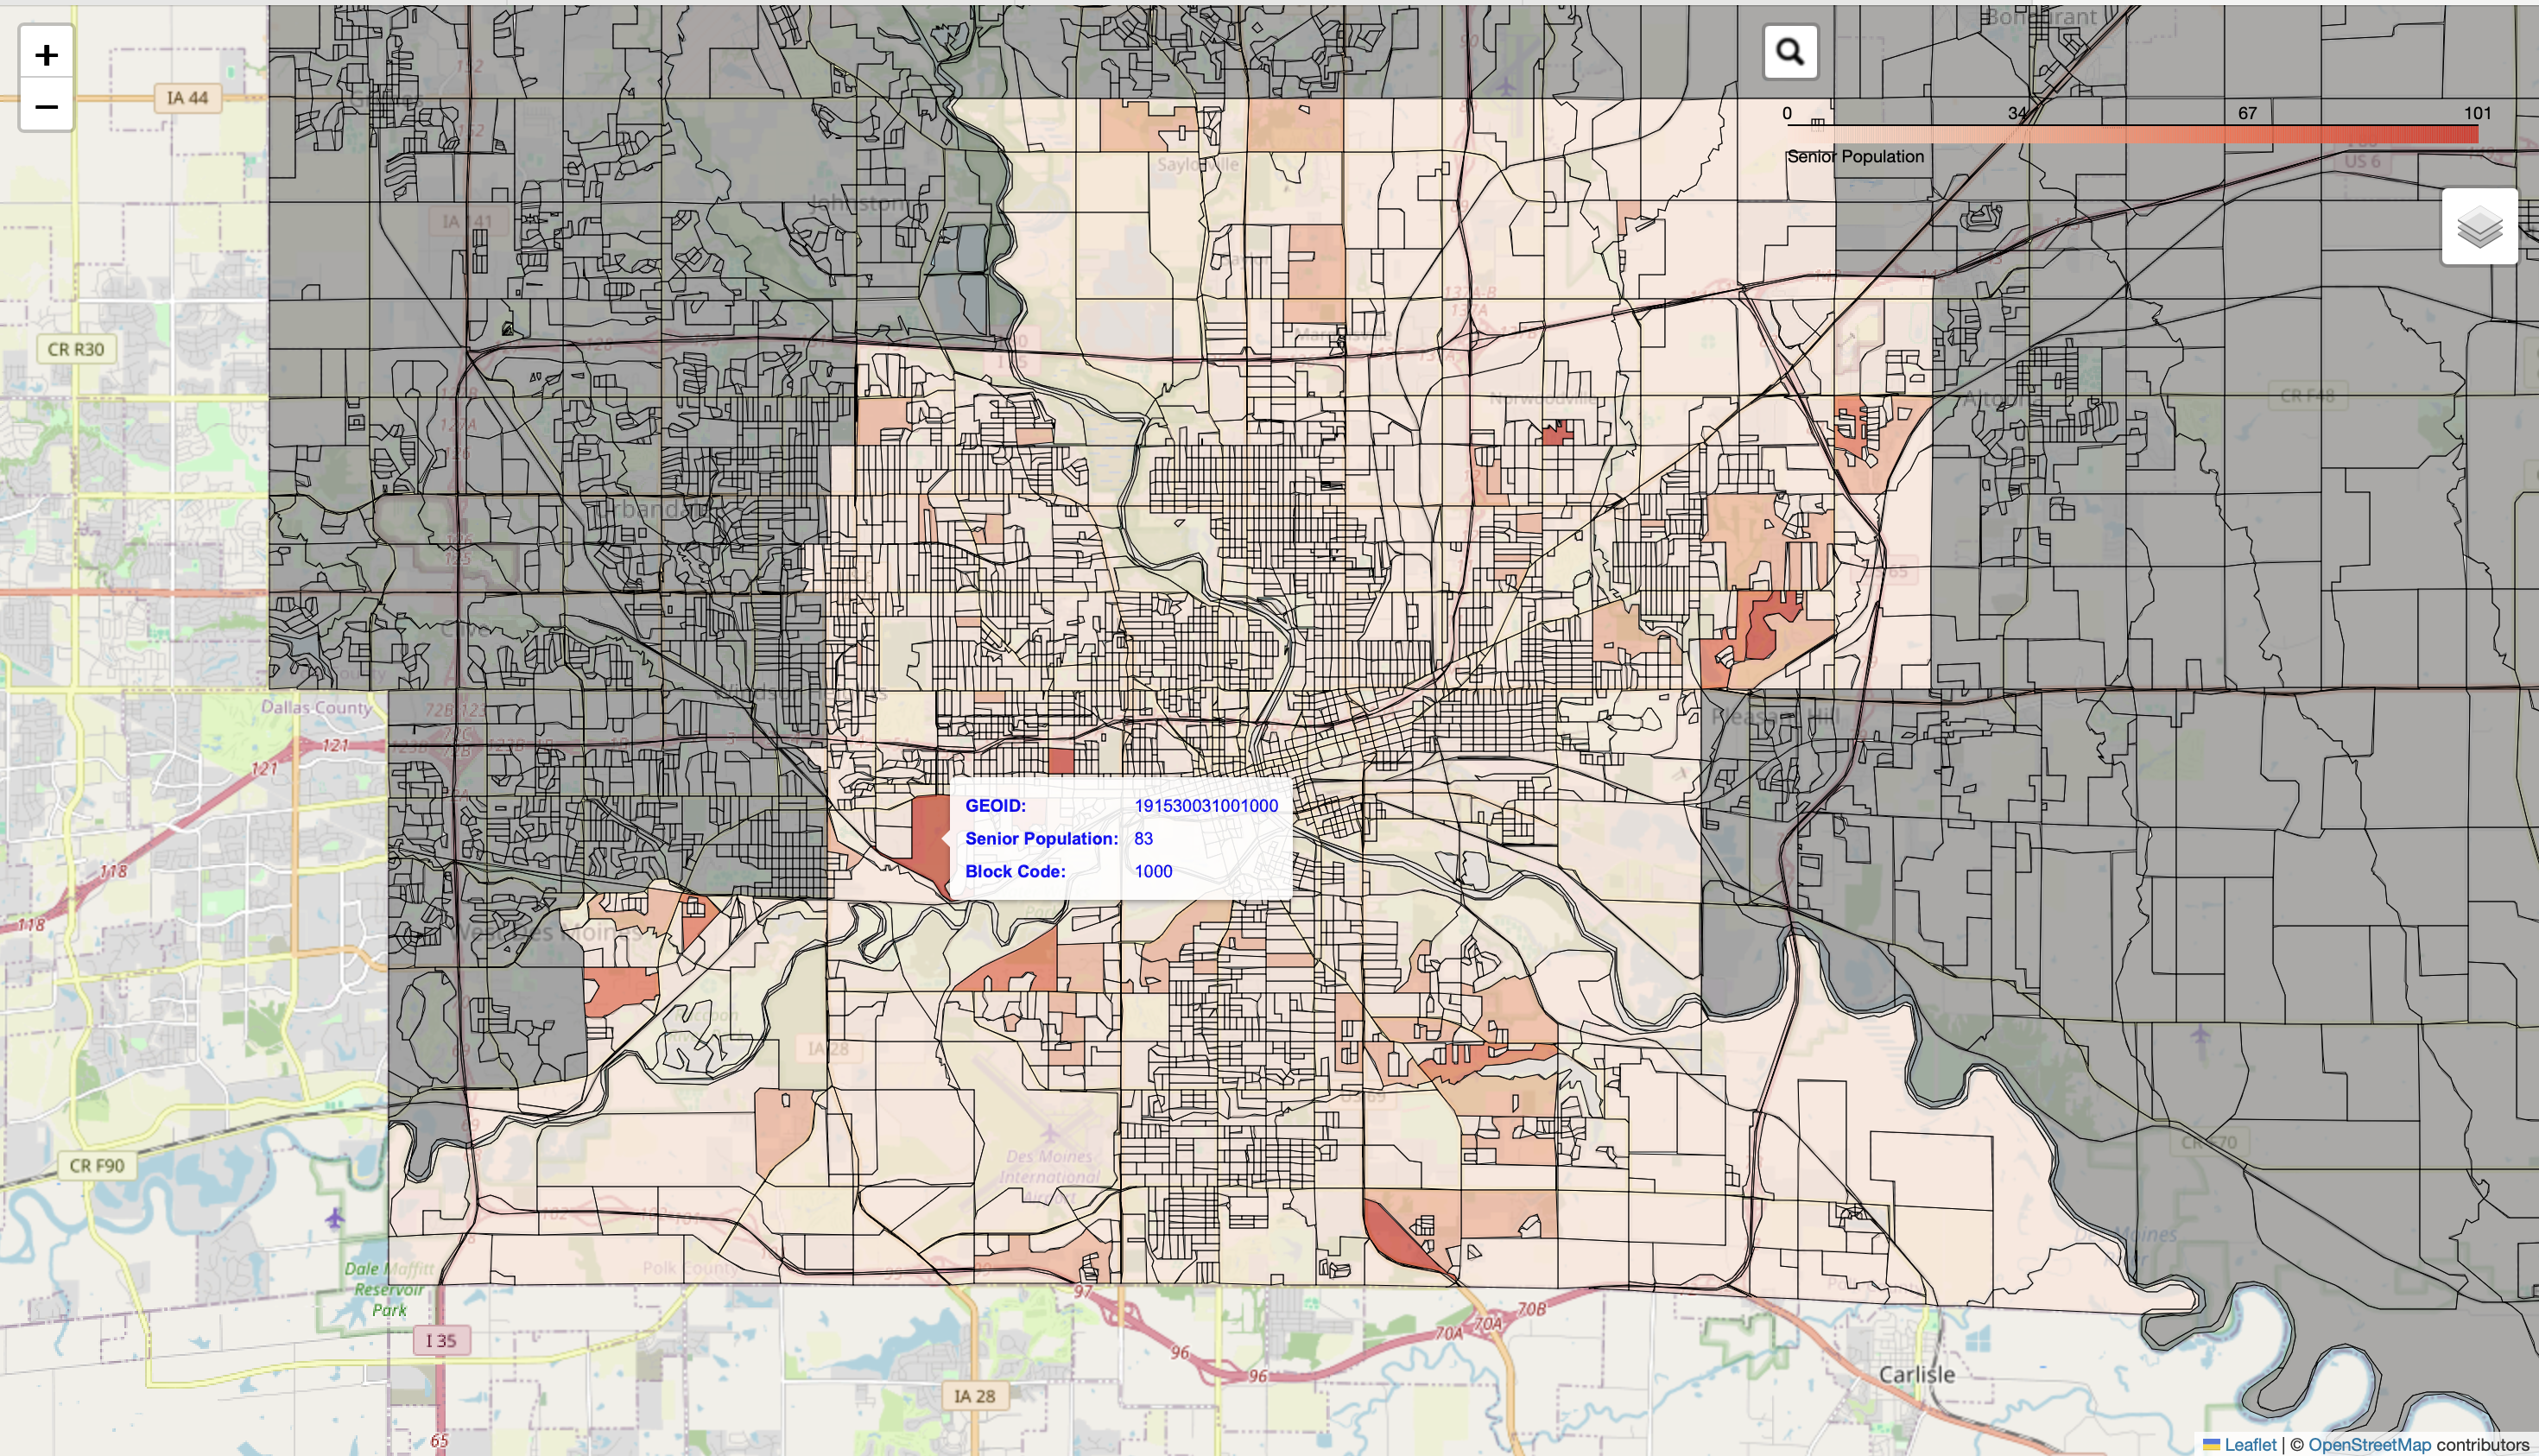
We have developed a function to generate maps for block-level data, based on user inputs. This function dynamically creates visual representations based on the specific data provided by users, allowing for precise and informative geographical insights.
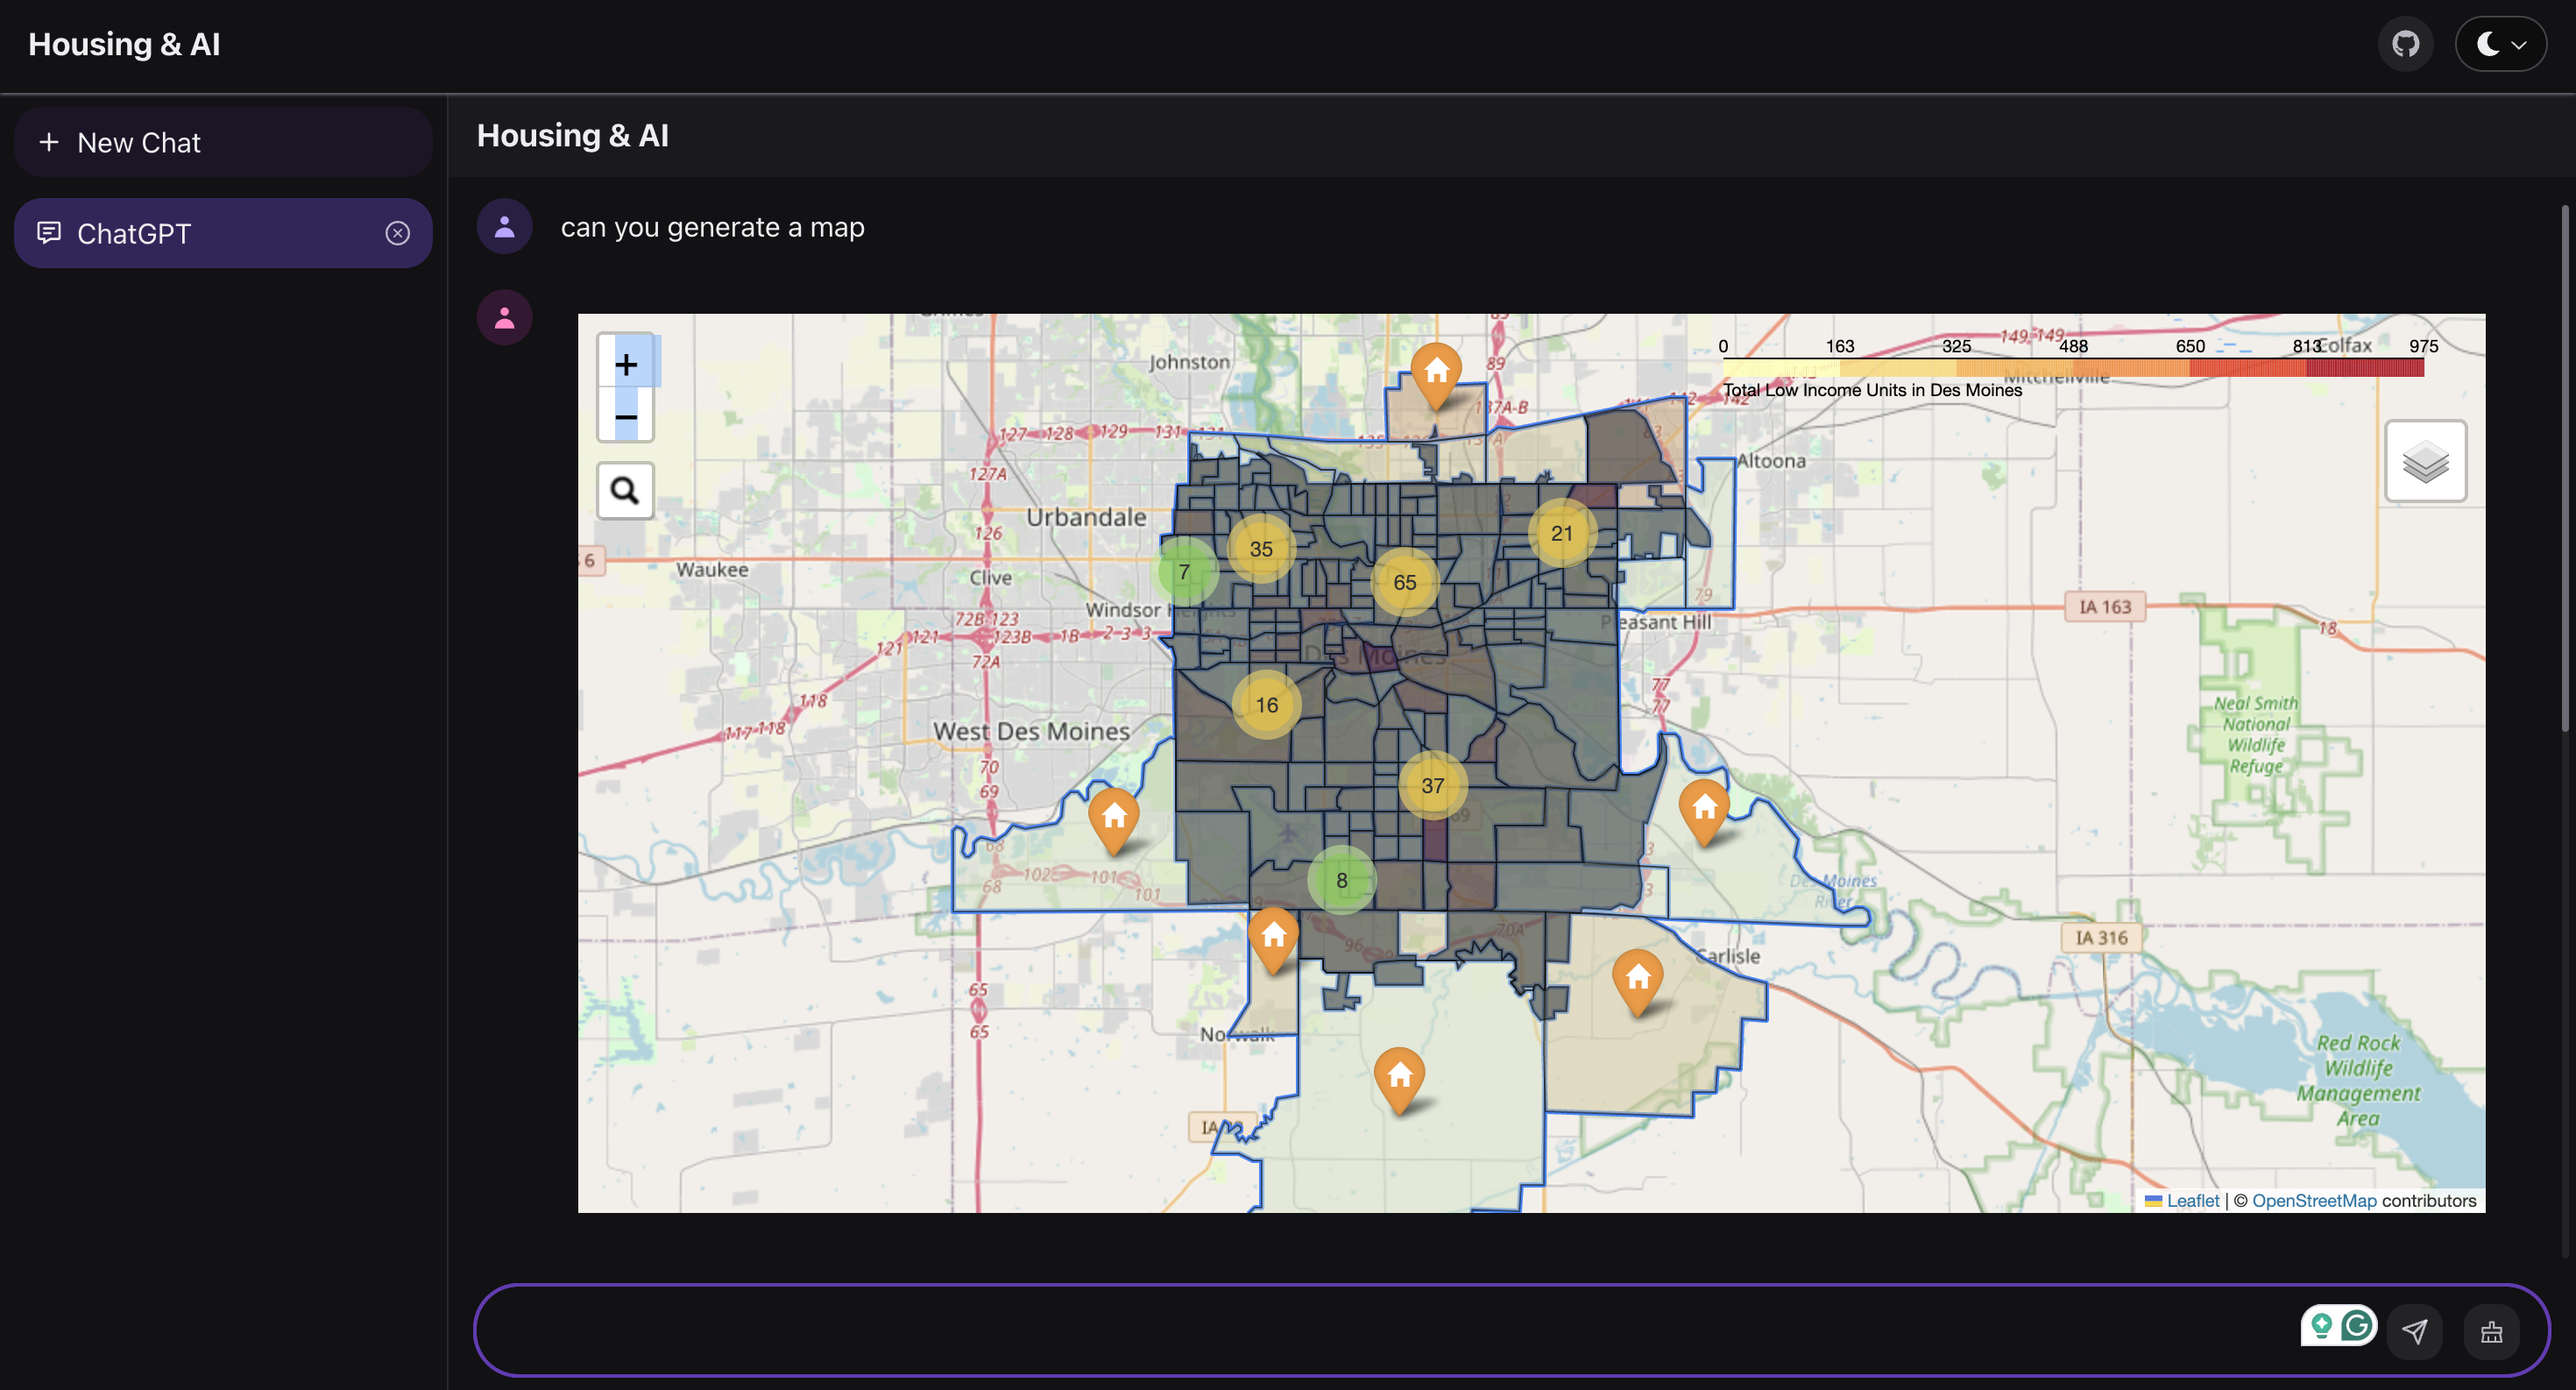
User Interface (UI)
We are focusing on the user interface (UI) side of our web application, we are using React JS to make everything look good and work smoothly. Our main goal is to connect this with our backend so that we can bring features like interactive maps and live chats to life. This integration is all about making our app not just visually appealing but also really easy to use. we want to ensure that users can easily navigate the app and make sense of the data they see, enhancing their overall experience.
Satellite Imagery
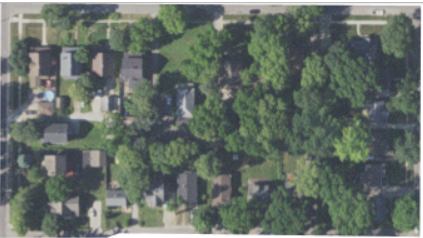
This week we made progress toward conforming a data set of satellite imagery. Using more defined imagery from the Natural Agriculture Imagery Program (NAIP) and building geospacial data from the Des Moines Data Portal, we were able to create a data set of both satellite images and a image mask of buildings within a census block. This was then expanded to cover more area, as now we can capture images and create masks for each building in the Des Moines area.
Shown below is an example of a census block satellite image along with it’s mask and then overlay-ed on top of each other.

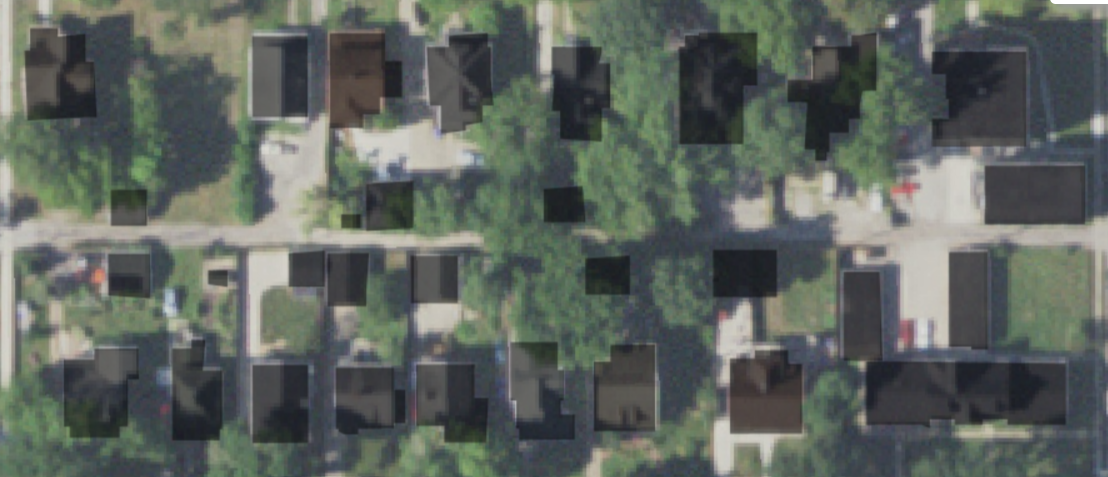
These images and masks will be used to fine tune our semantic segmentation model that will be able to take a satellite image and segment out the buildings in the image from their pixel values. The classification of these pixels will be determined in our model and builds will be labeled as 1 and the surrounding environment as 0. This will allow us to given a better visualization of a city and building’s layout when prompted by the user to plot a map in the chat bot.