Arts, Events, and Race
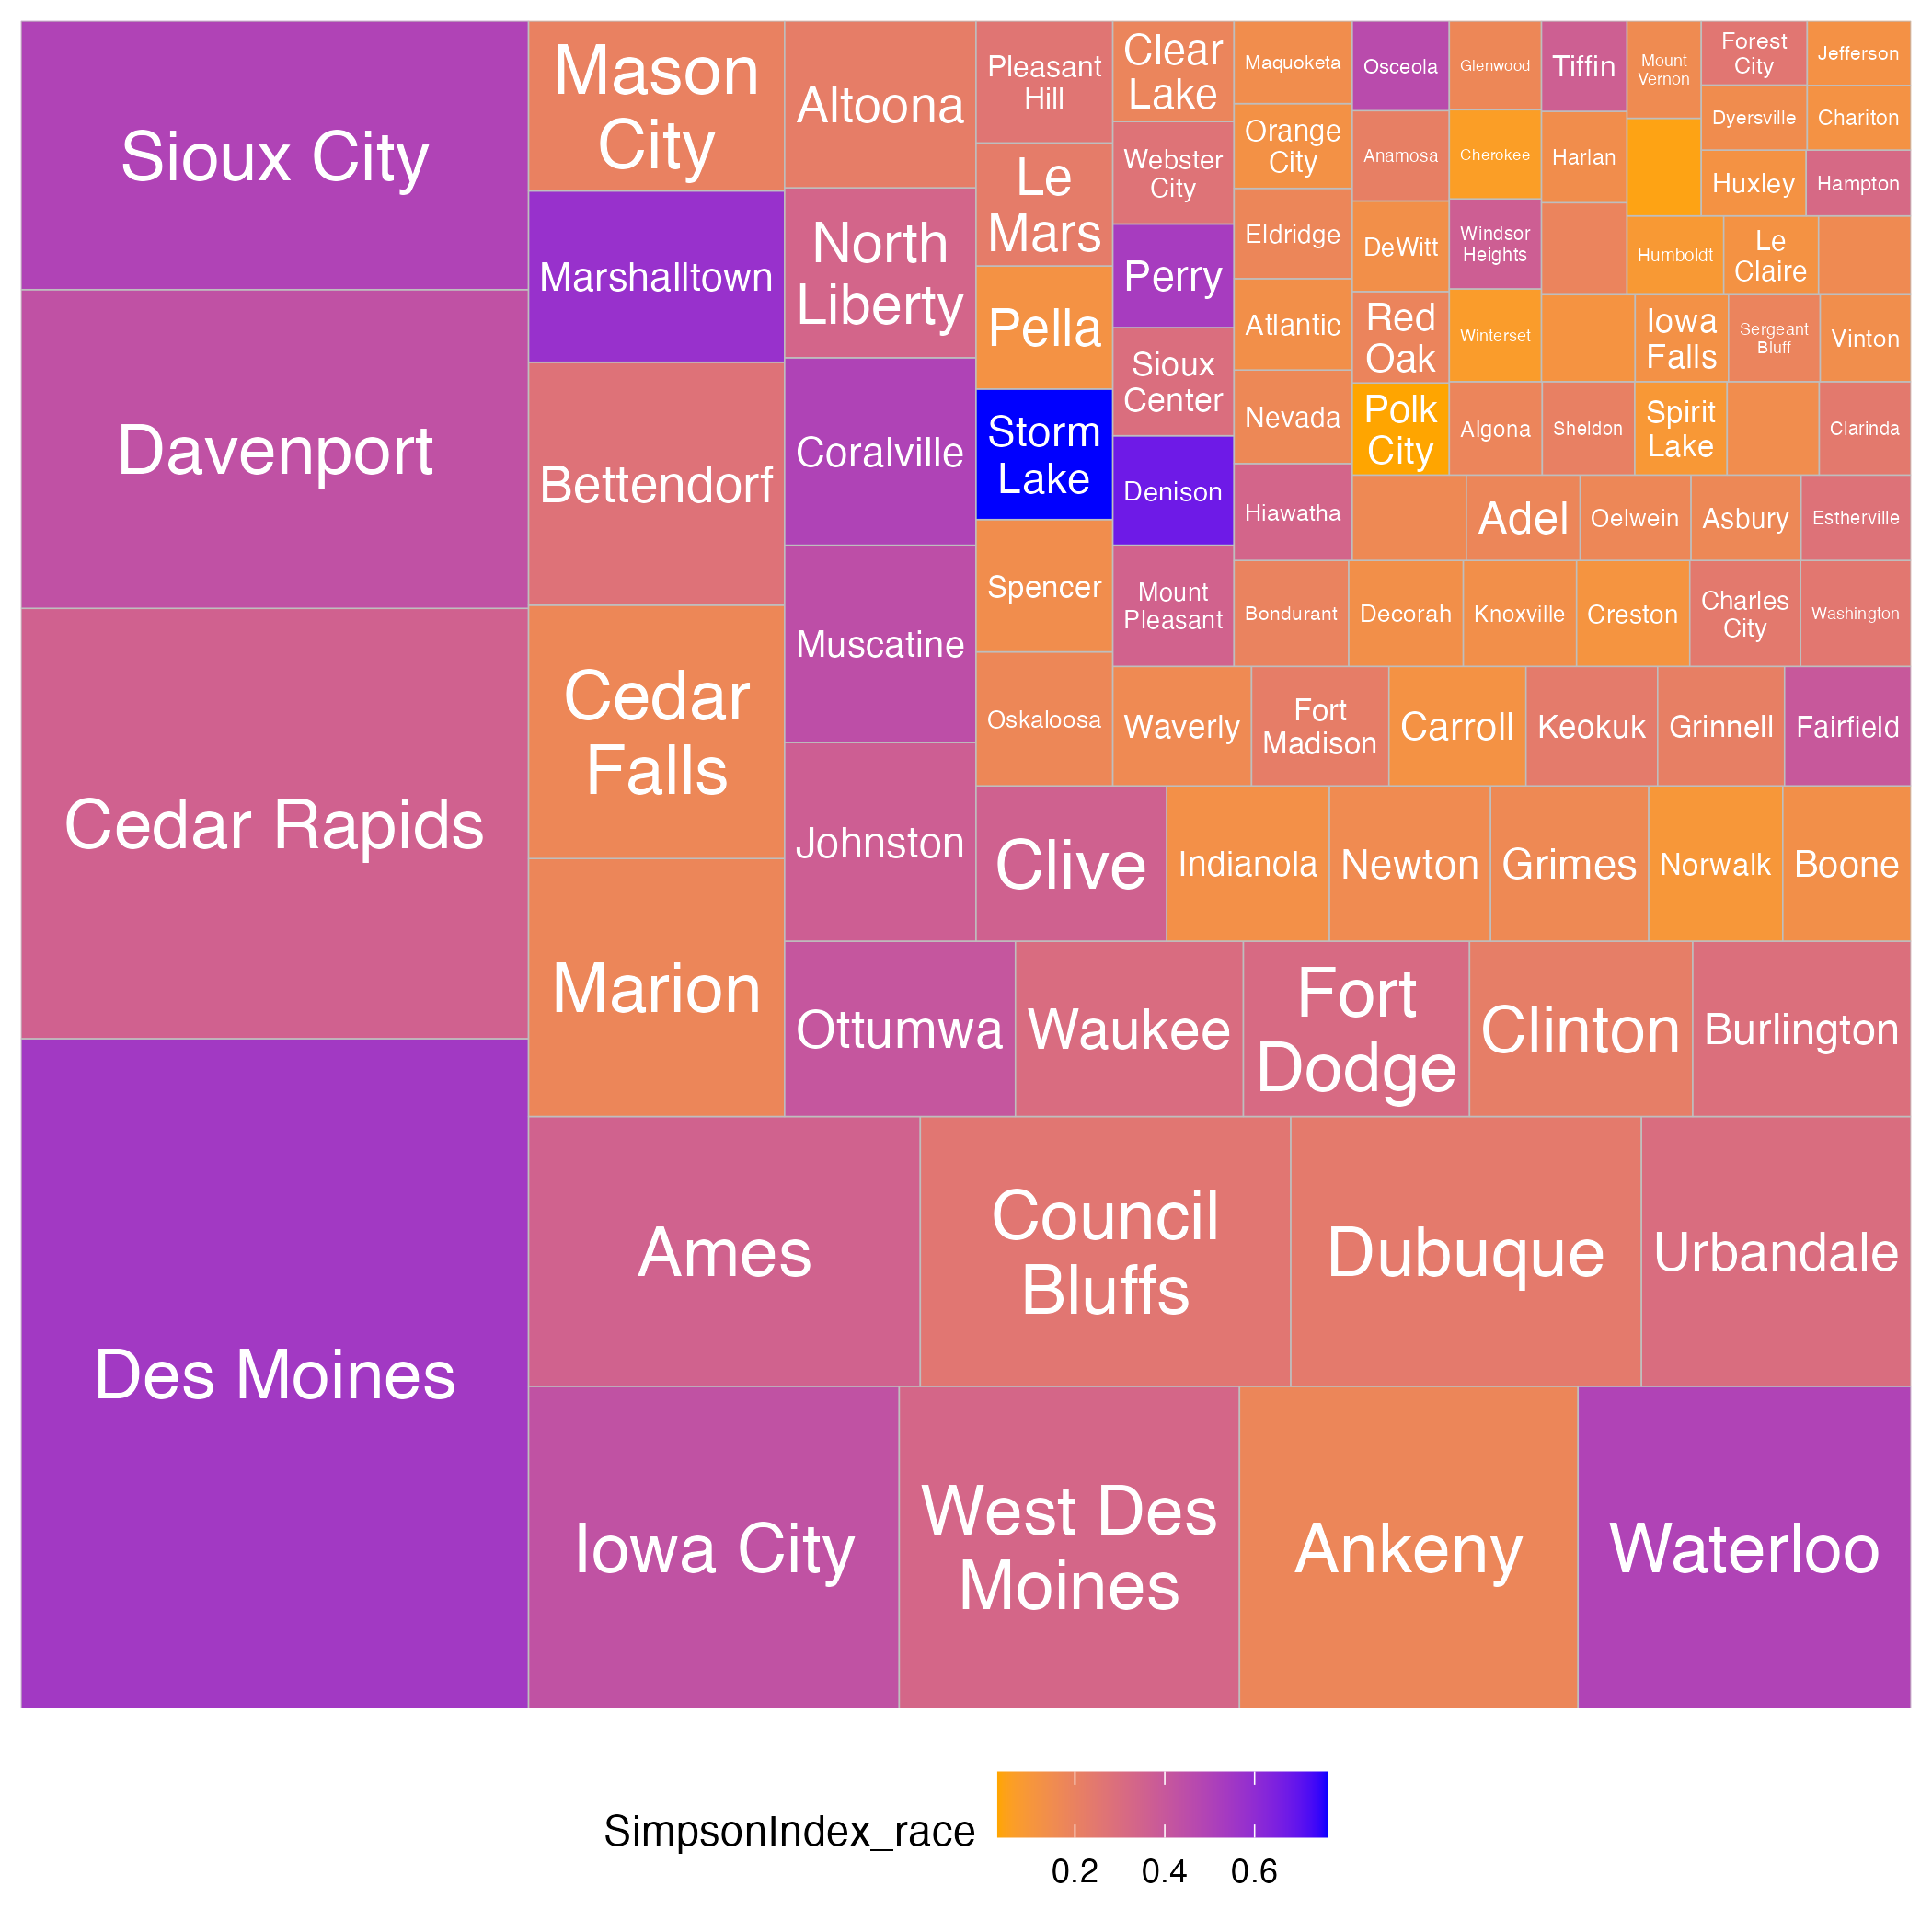
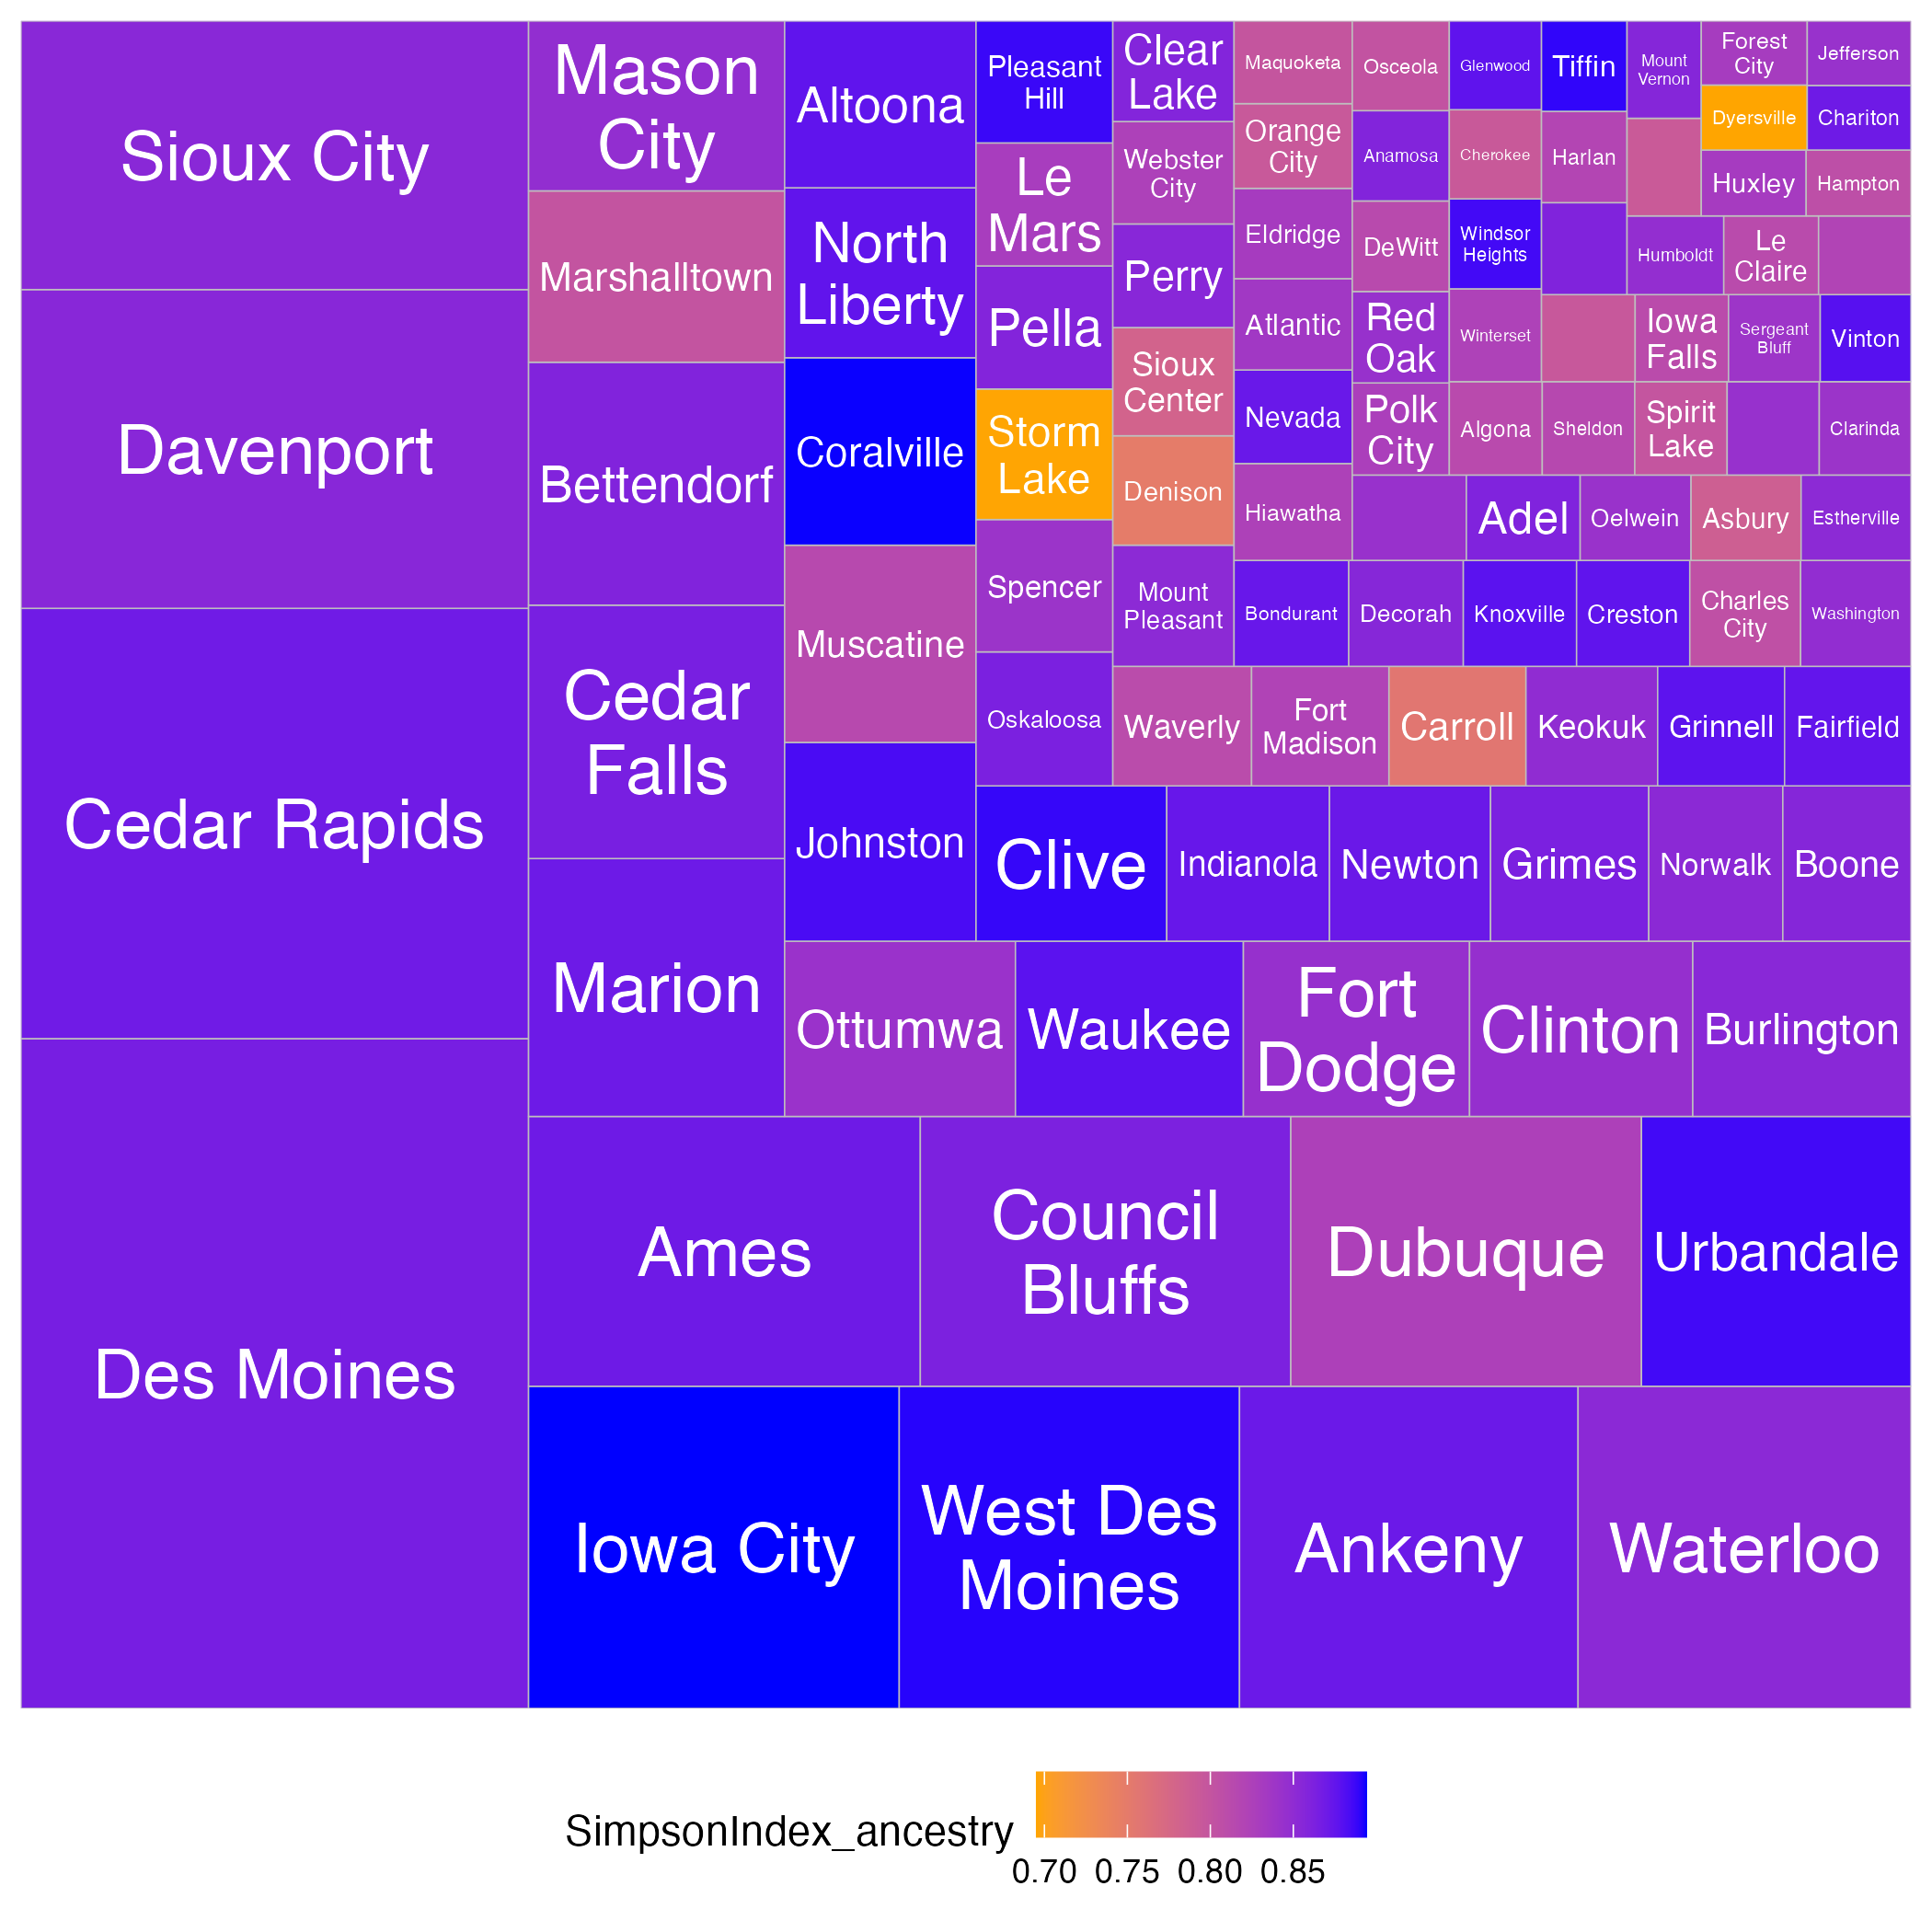
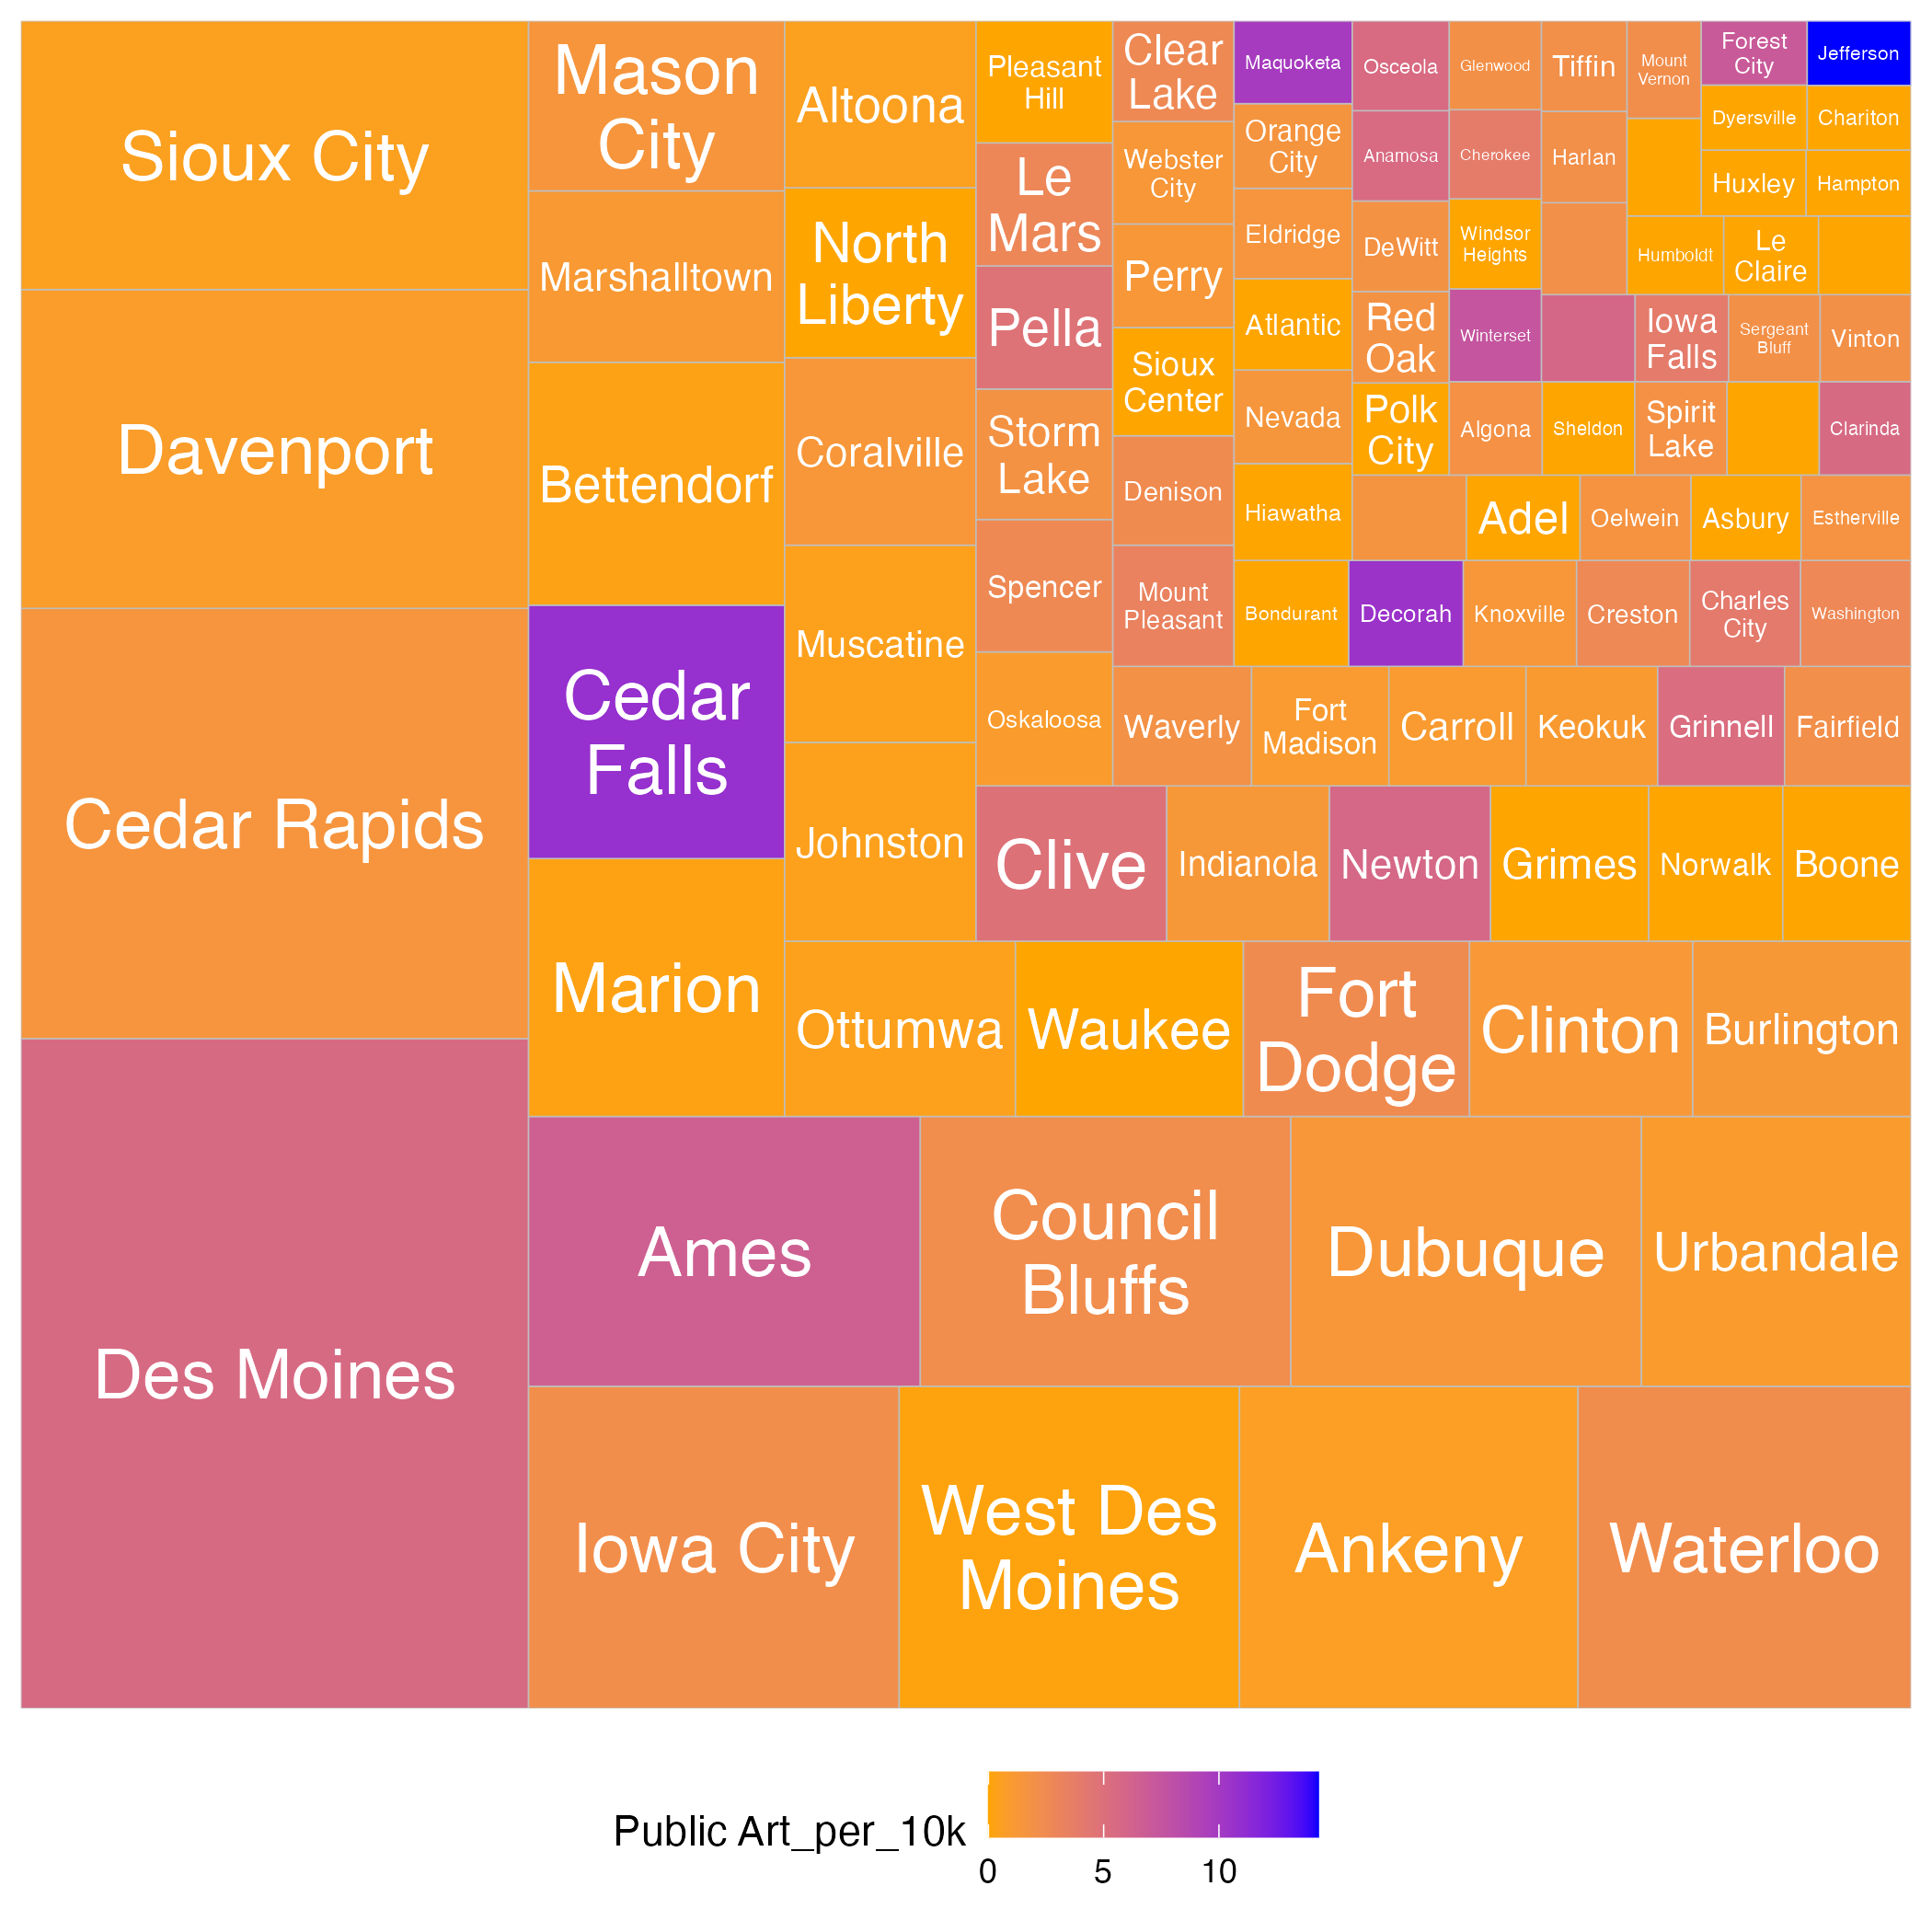
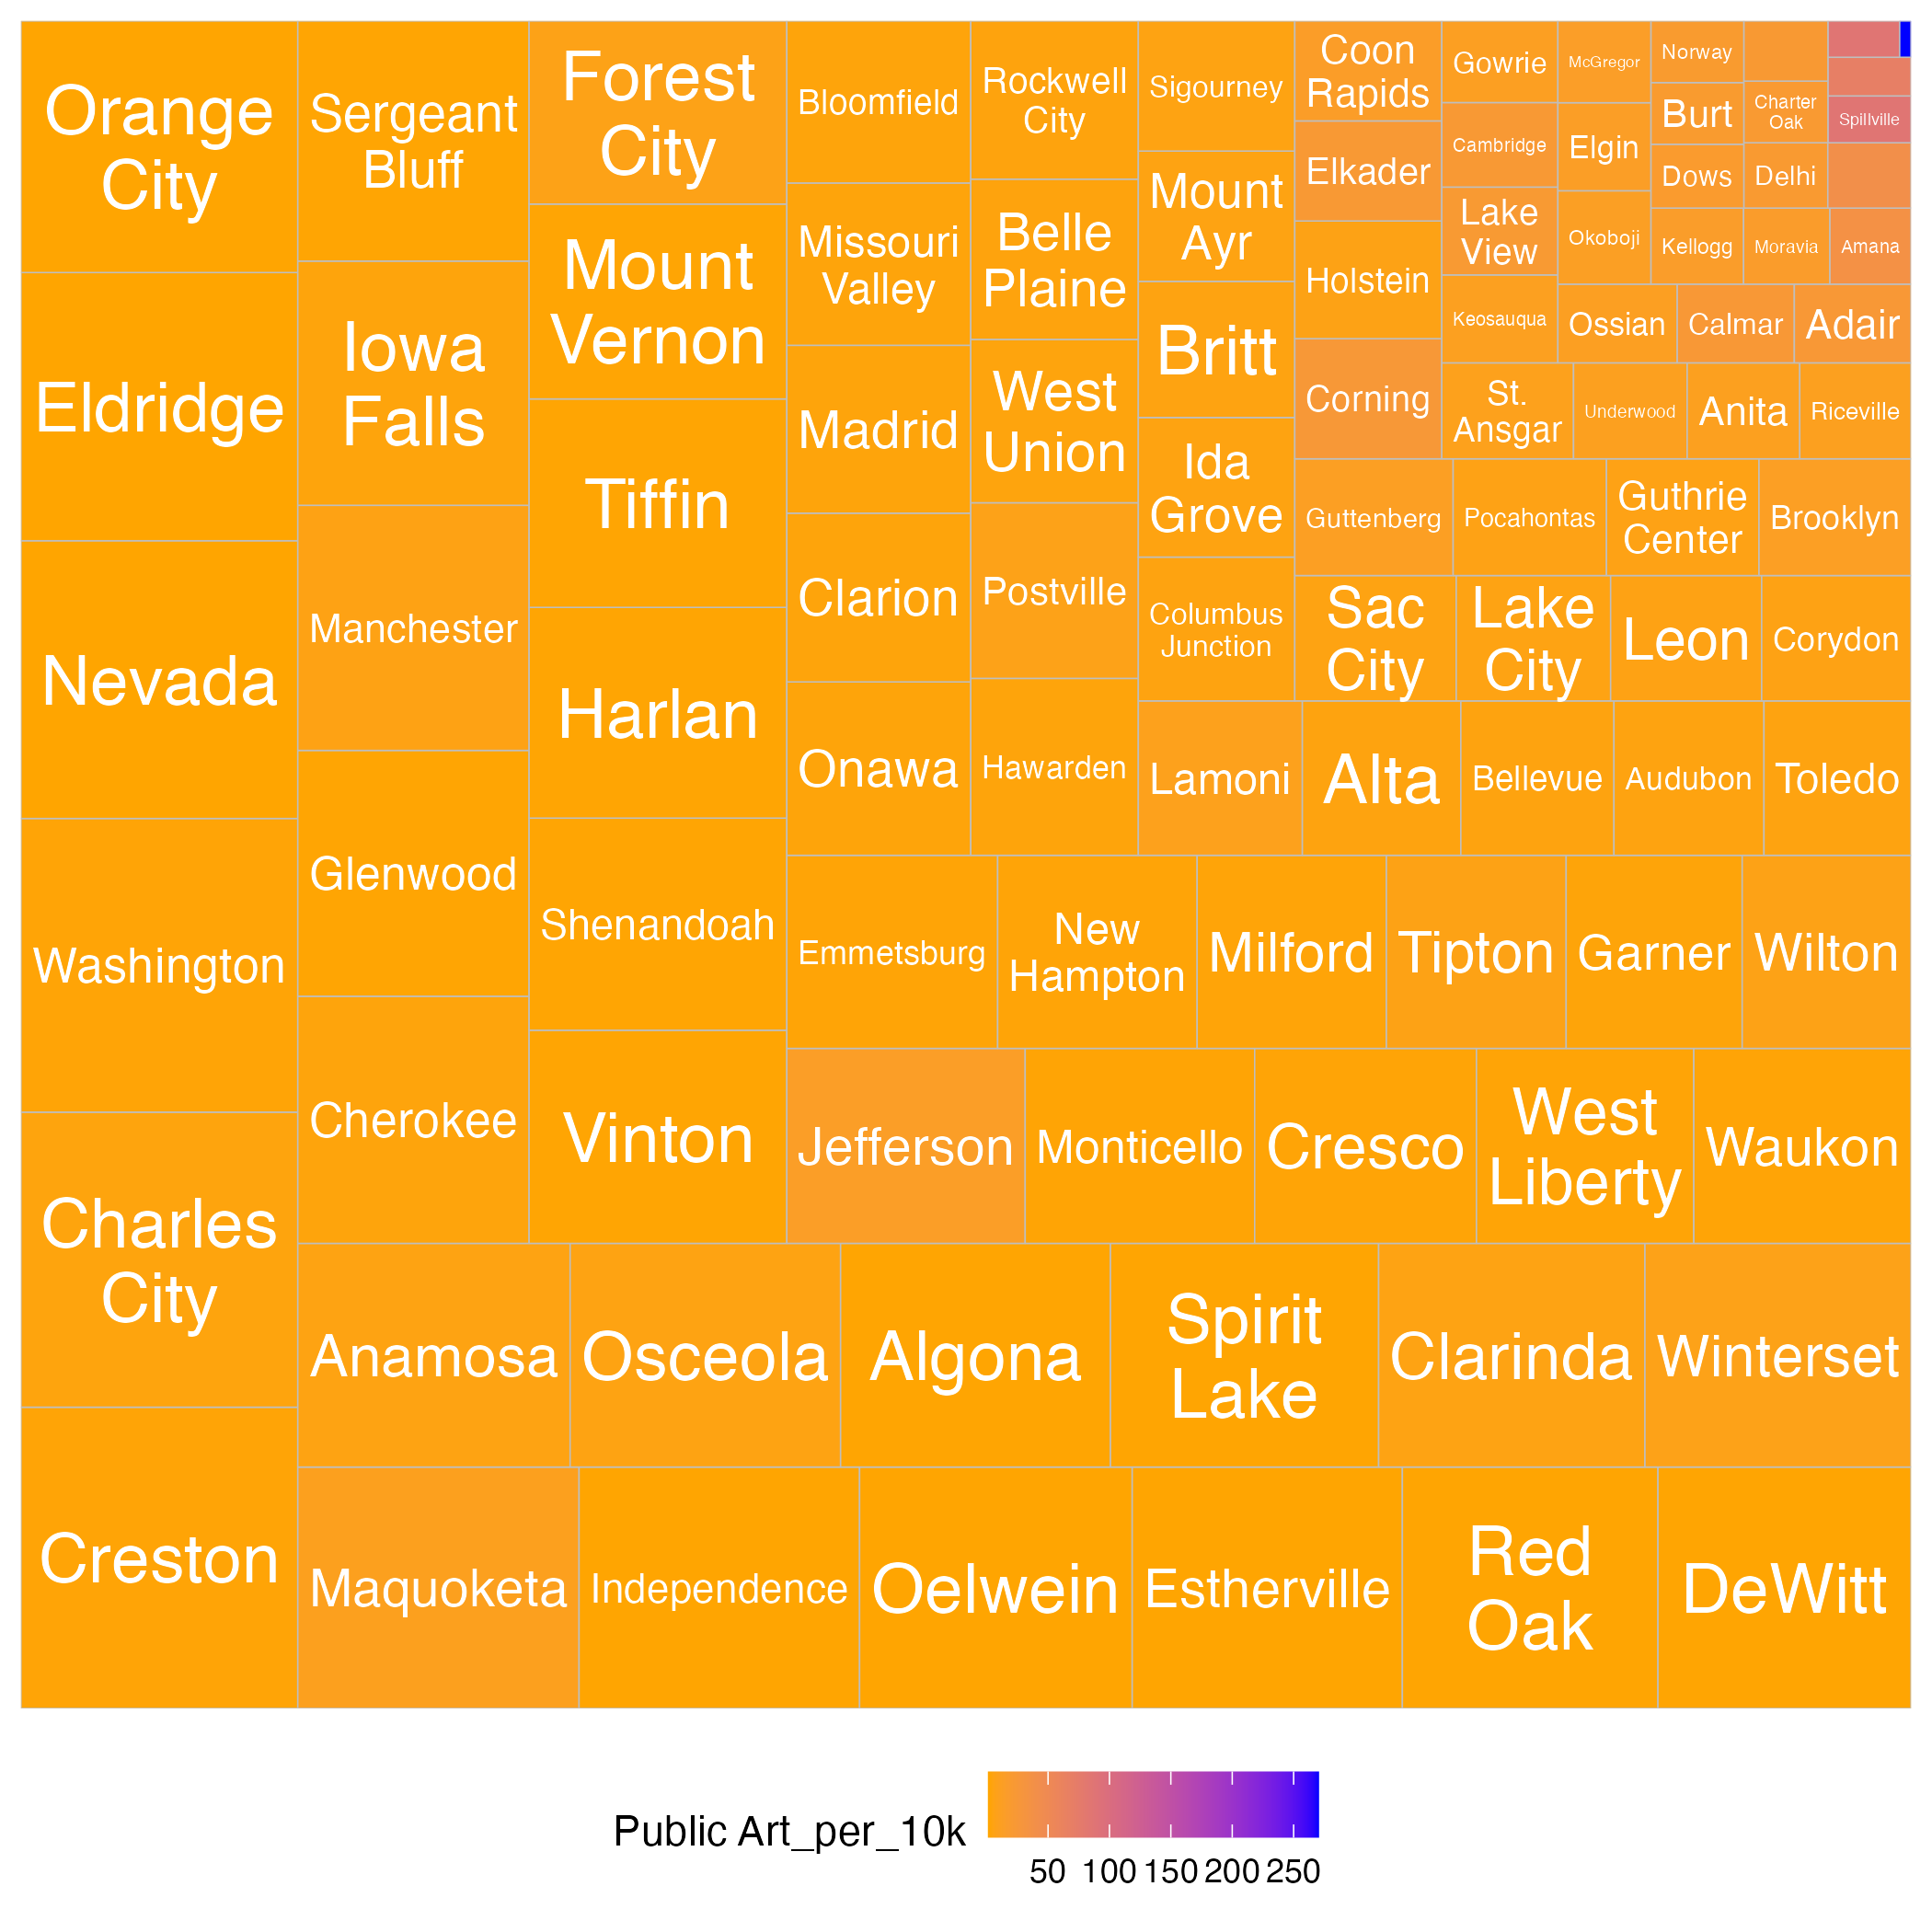
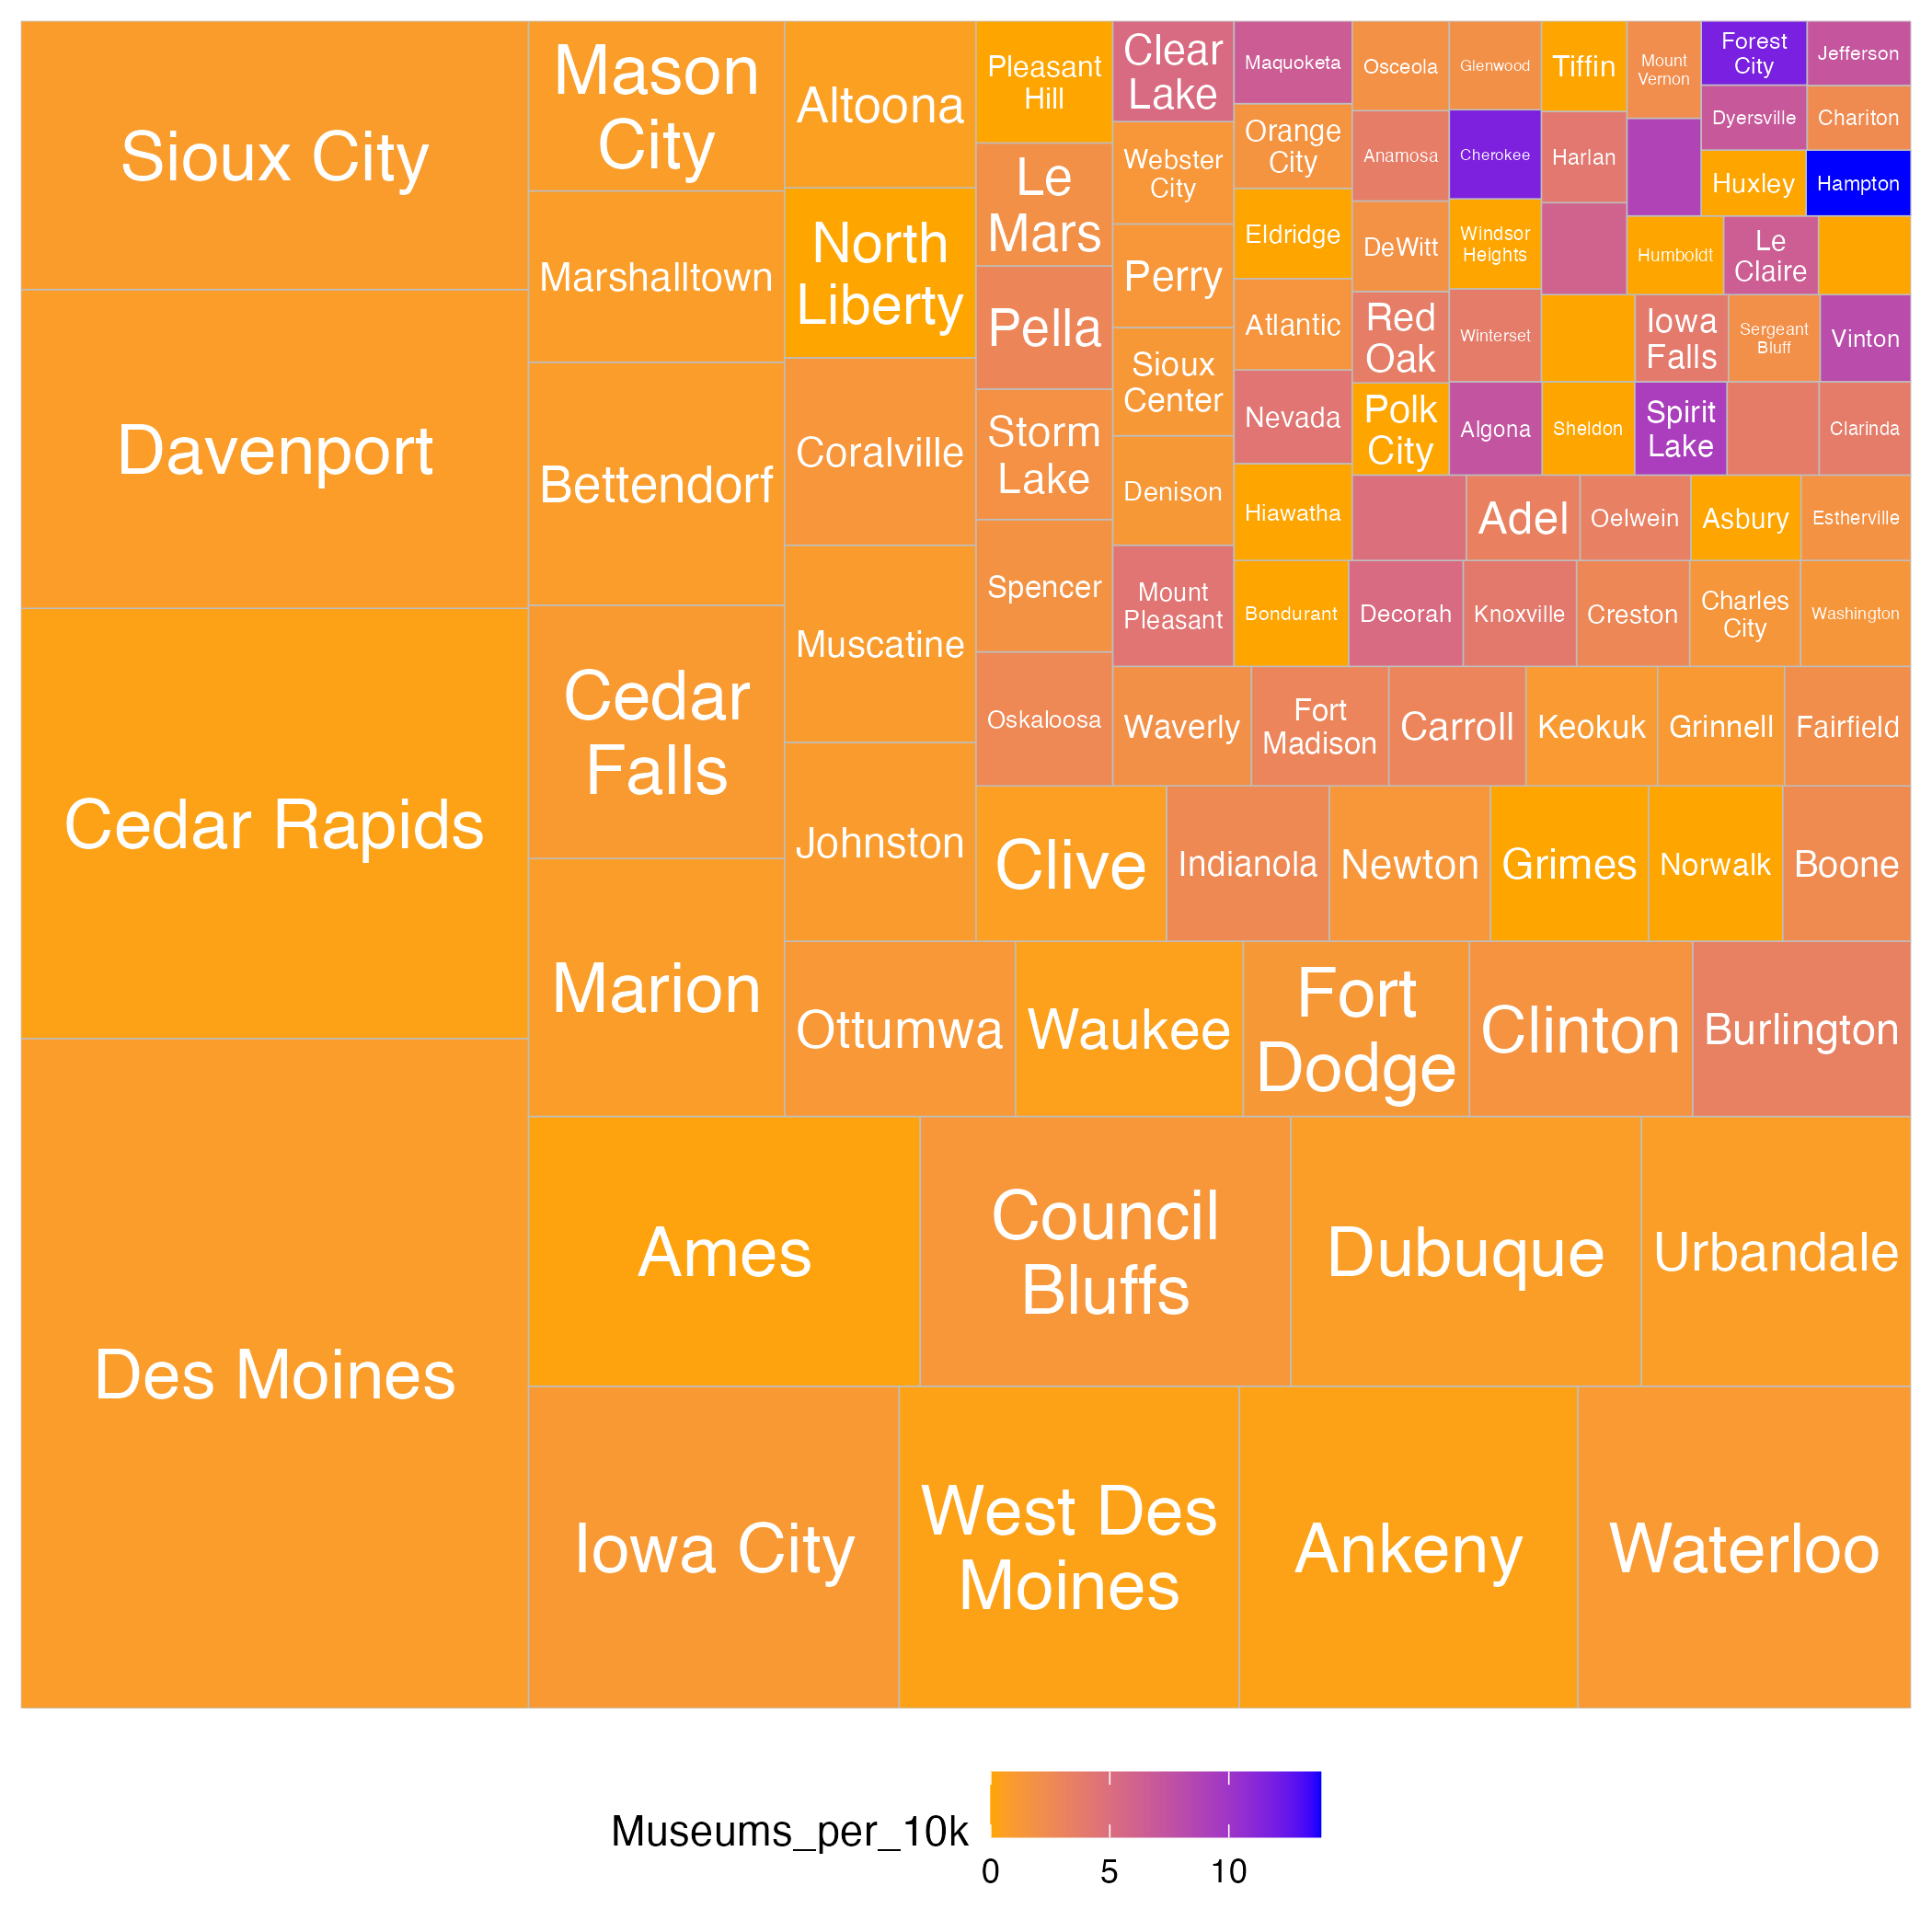
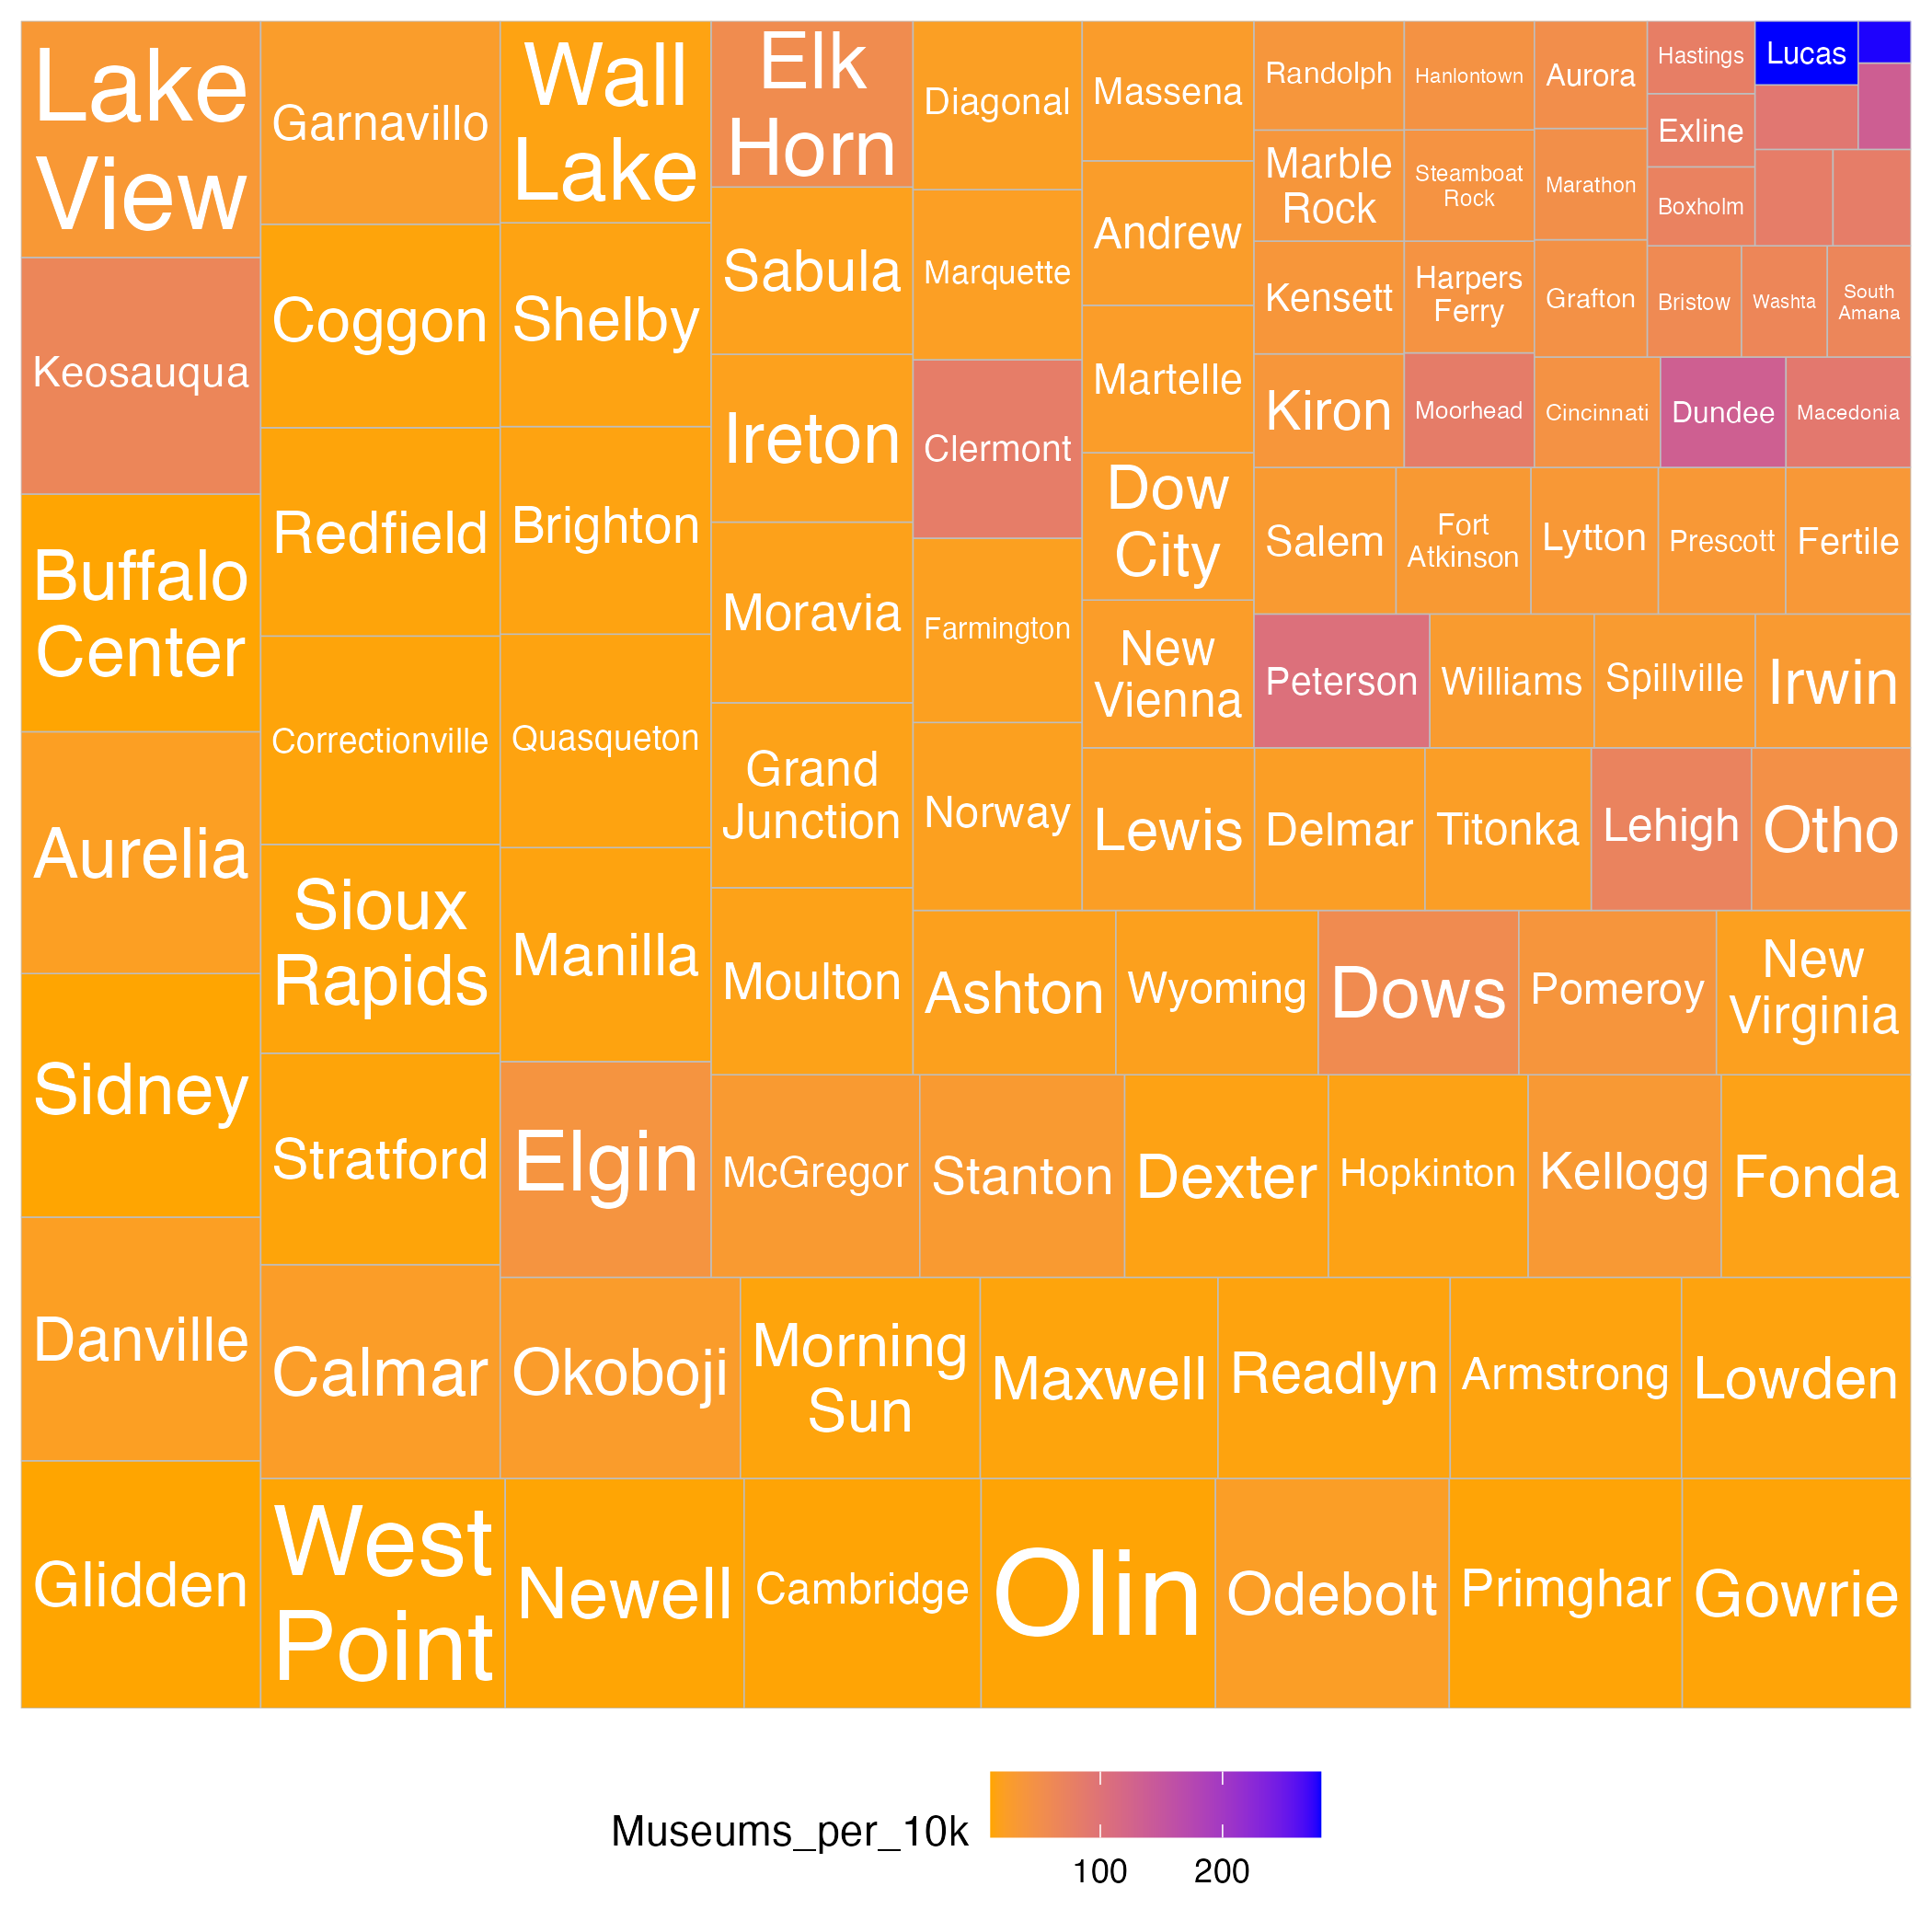
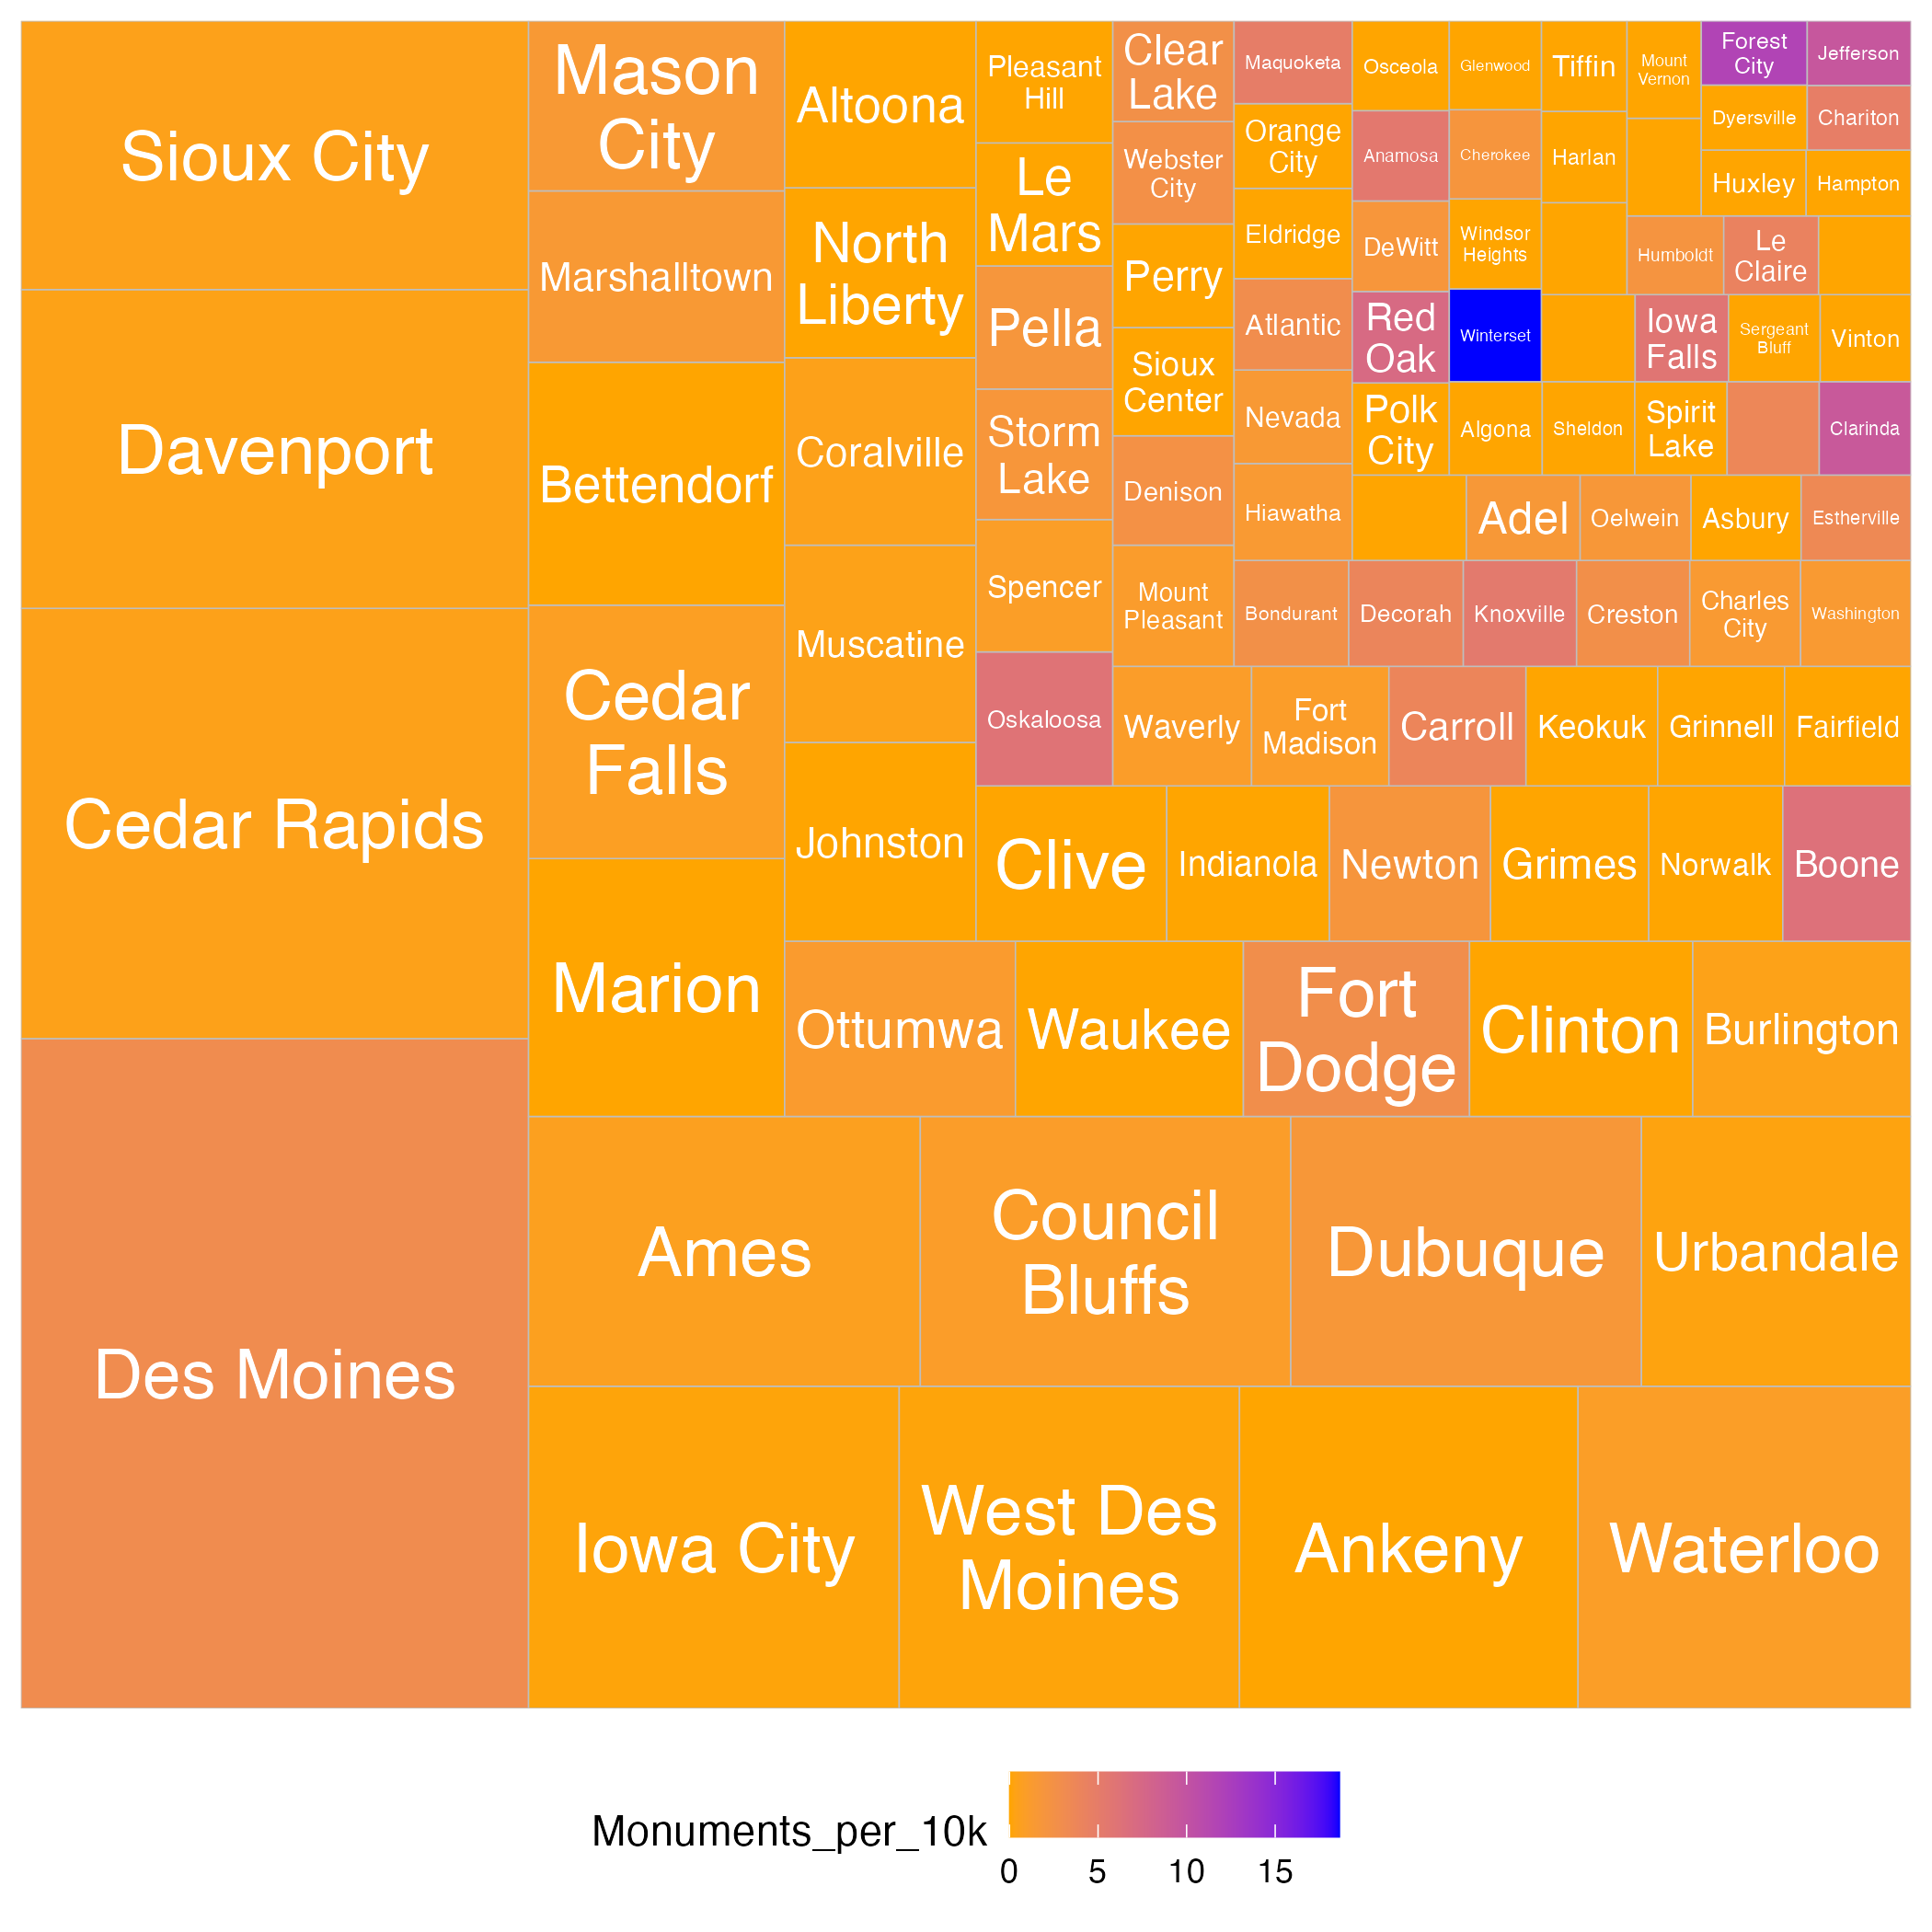
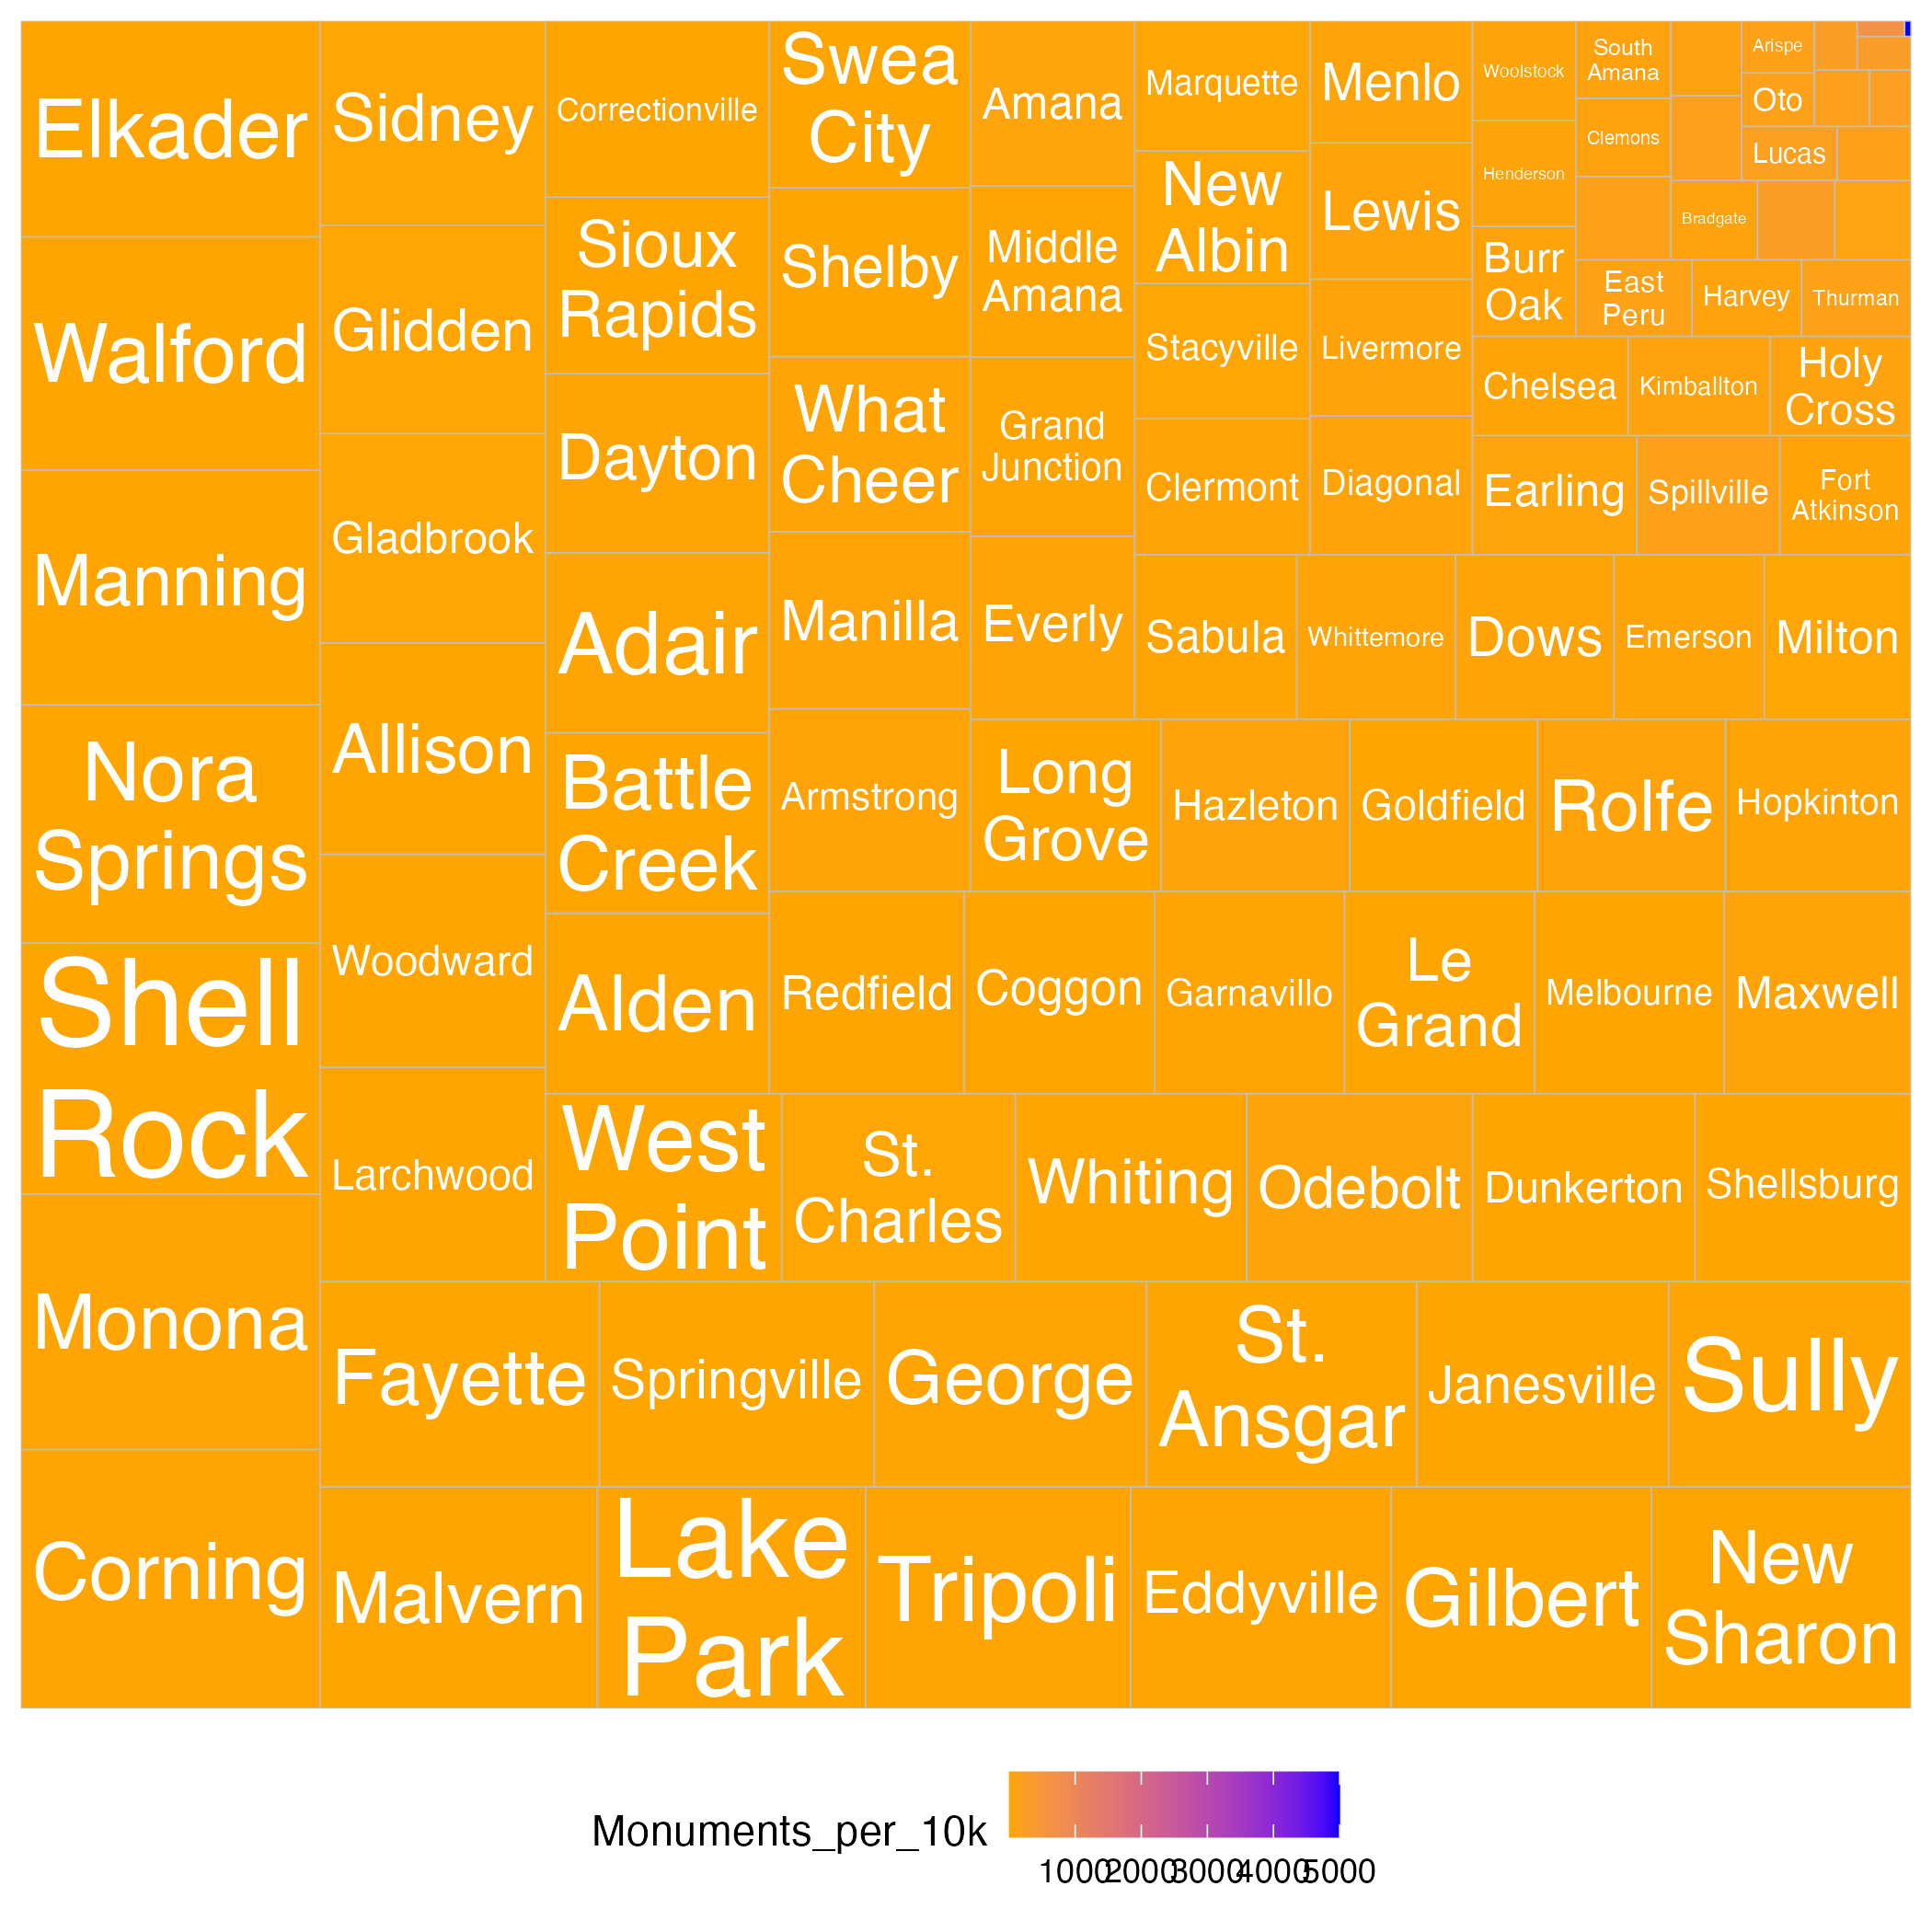
This week we continued to explore the arts, events, and race in Iowa. We created a few interactive maps. The size of the makers on the map represent the population in a city and the color represents that cultural indicator. There are treemaps underneath the maps. The size of the box represents the city population and the color represents the cultural indicator.
School District Changes in Iowa
We have also been looking at changes that have happened in schools around Iowa. We have information from 1945-2024. There are many different categories for school changes, the ones that we will be look at first are:
- First year for high school
- Last year for high school
- Last year for building
- Last year for district
Economic Development Projects
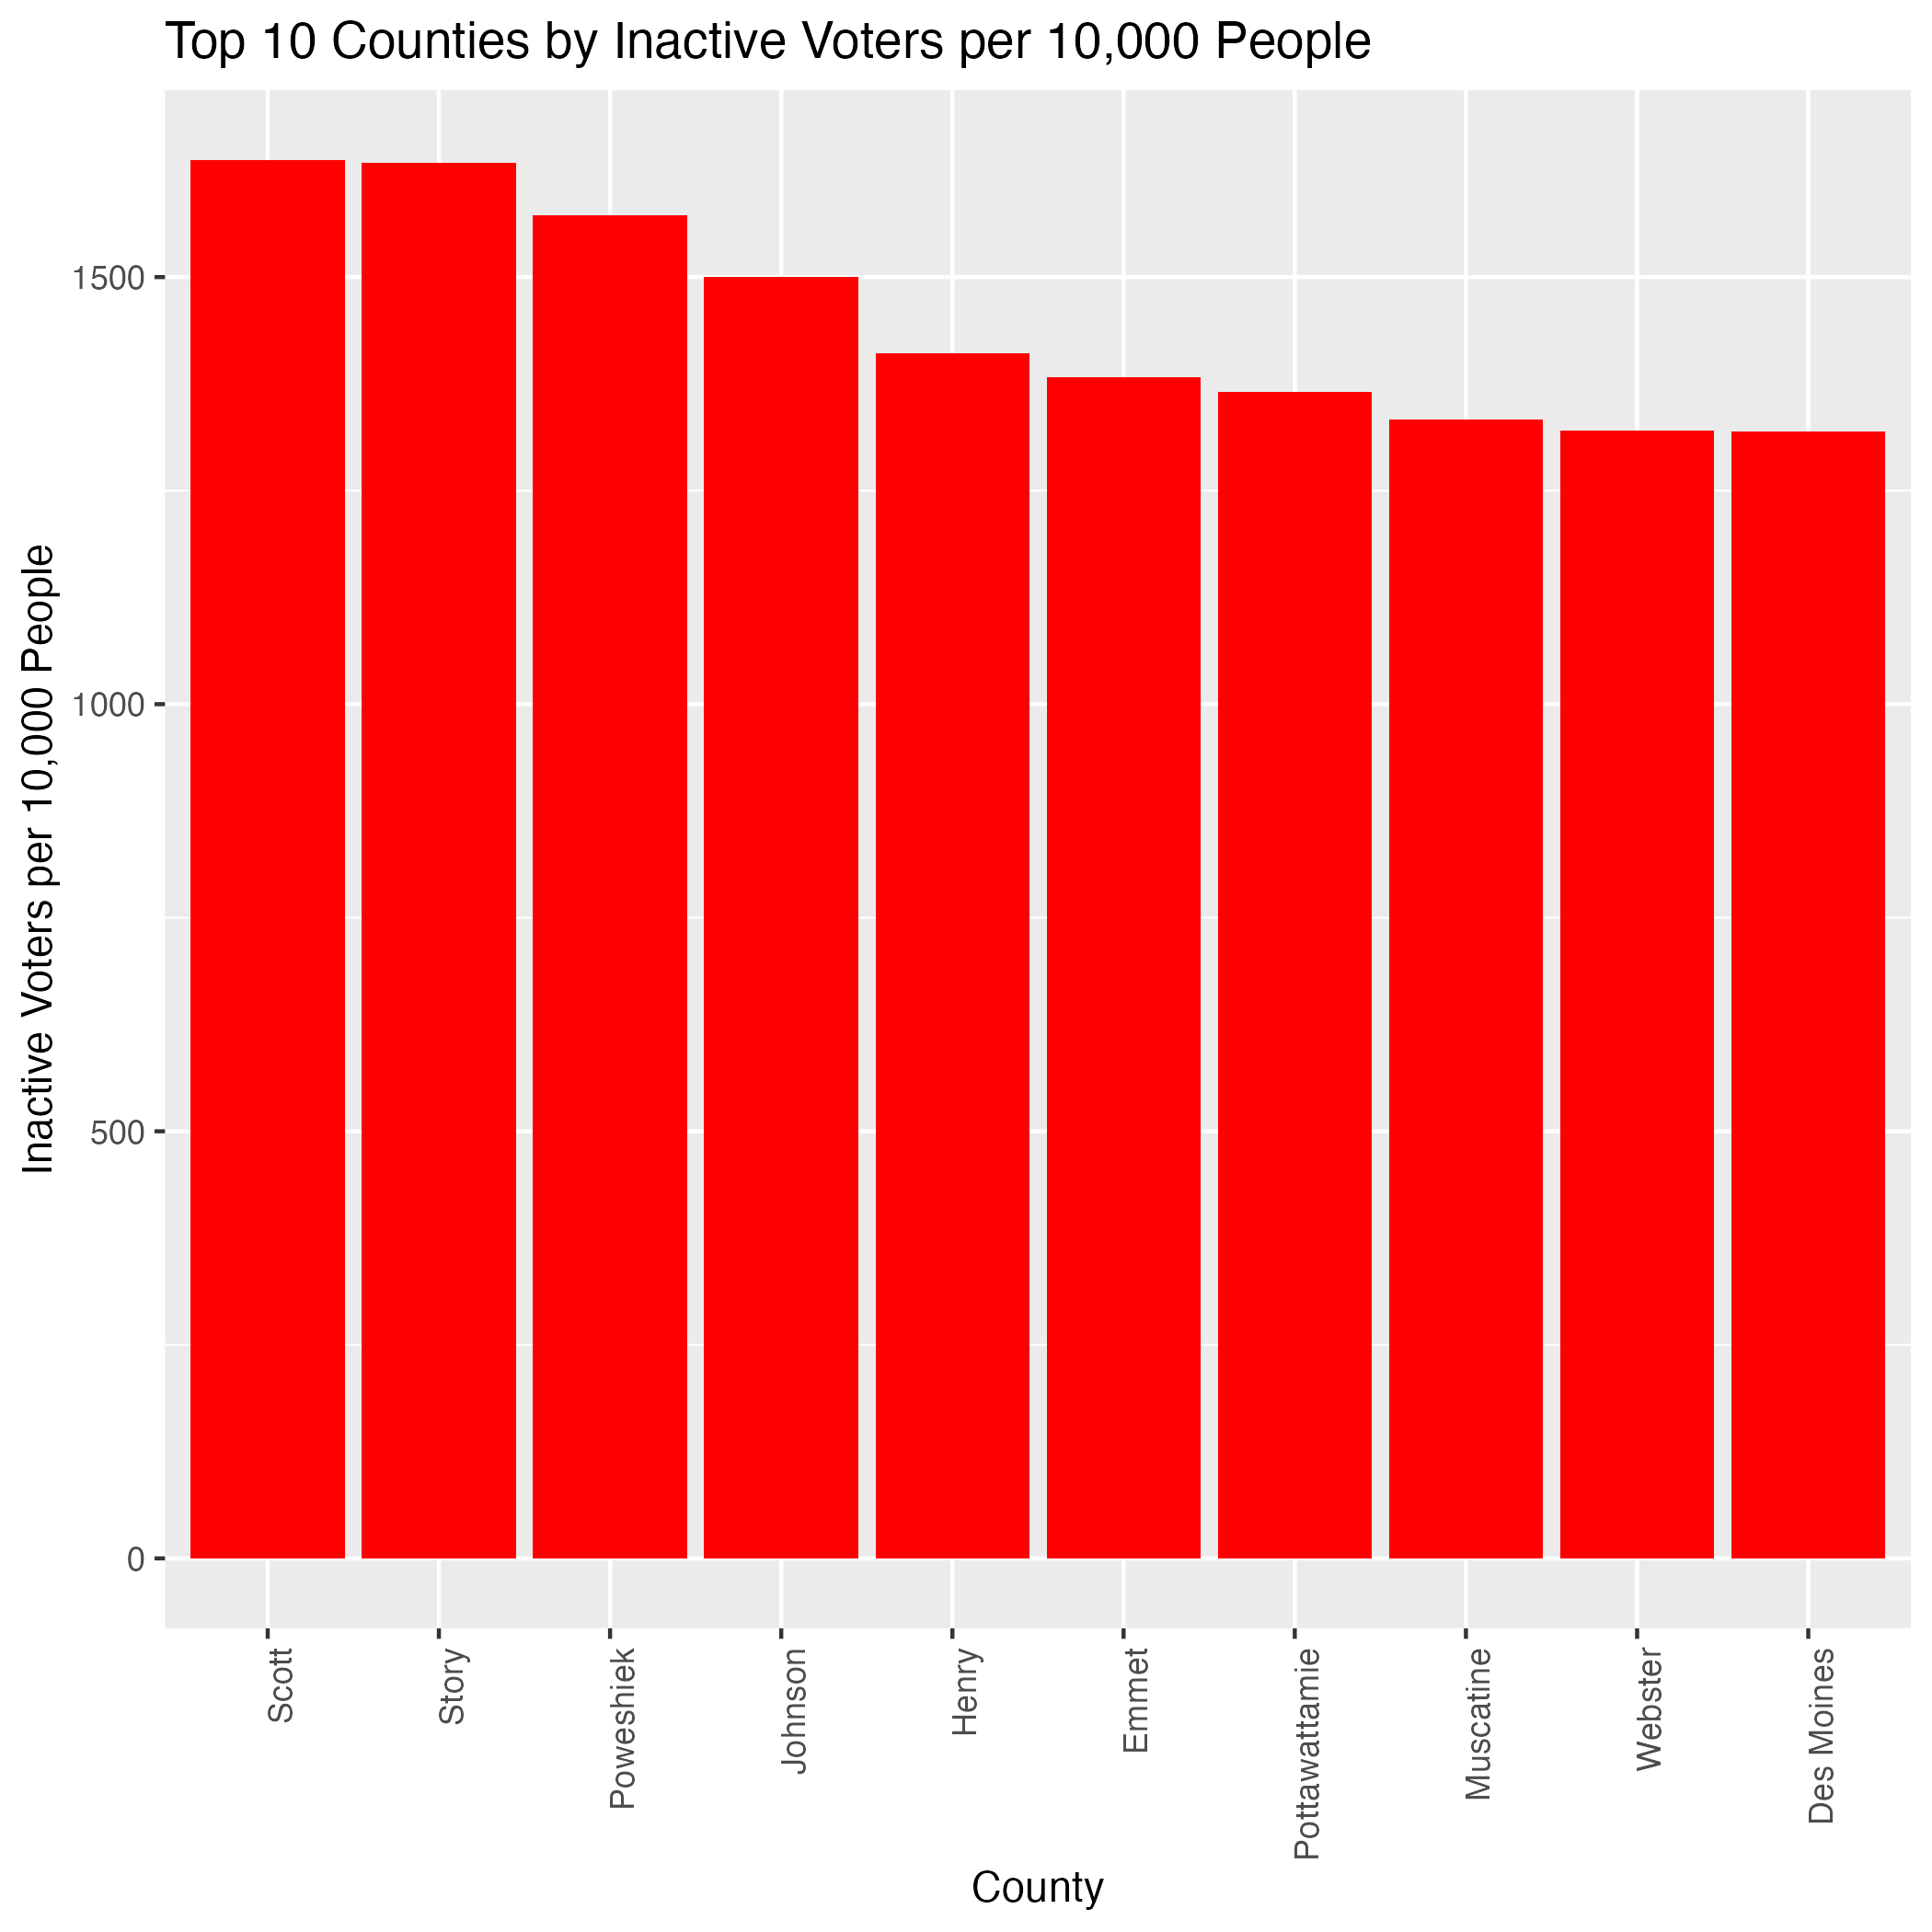
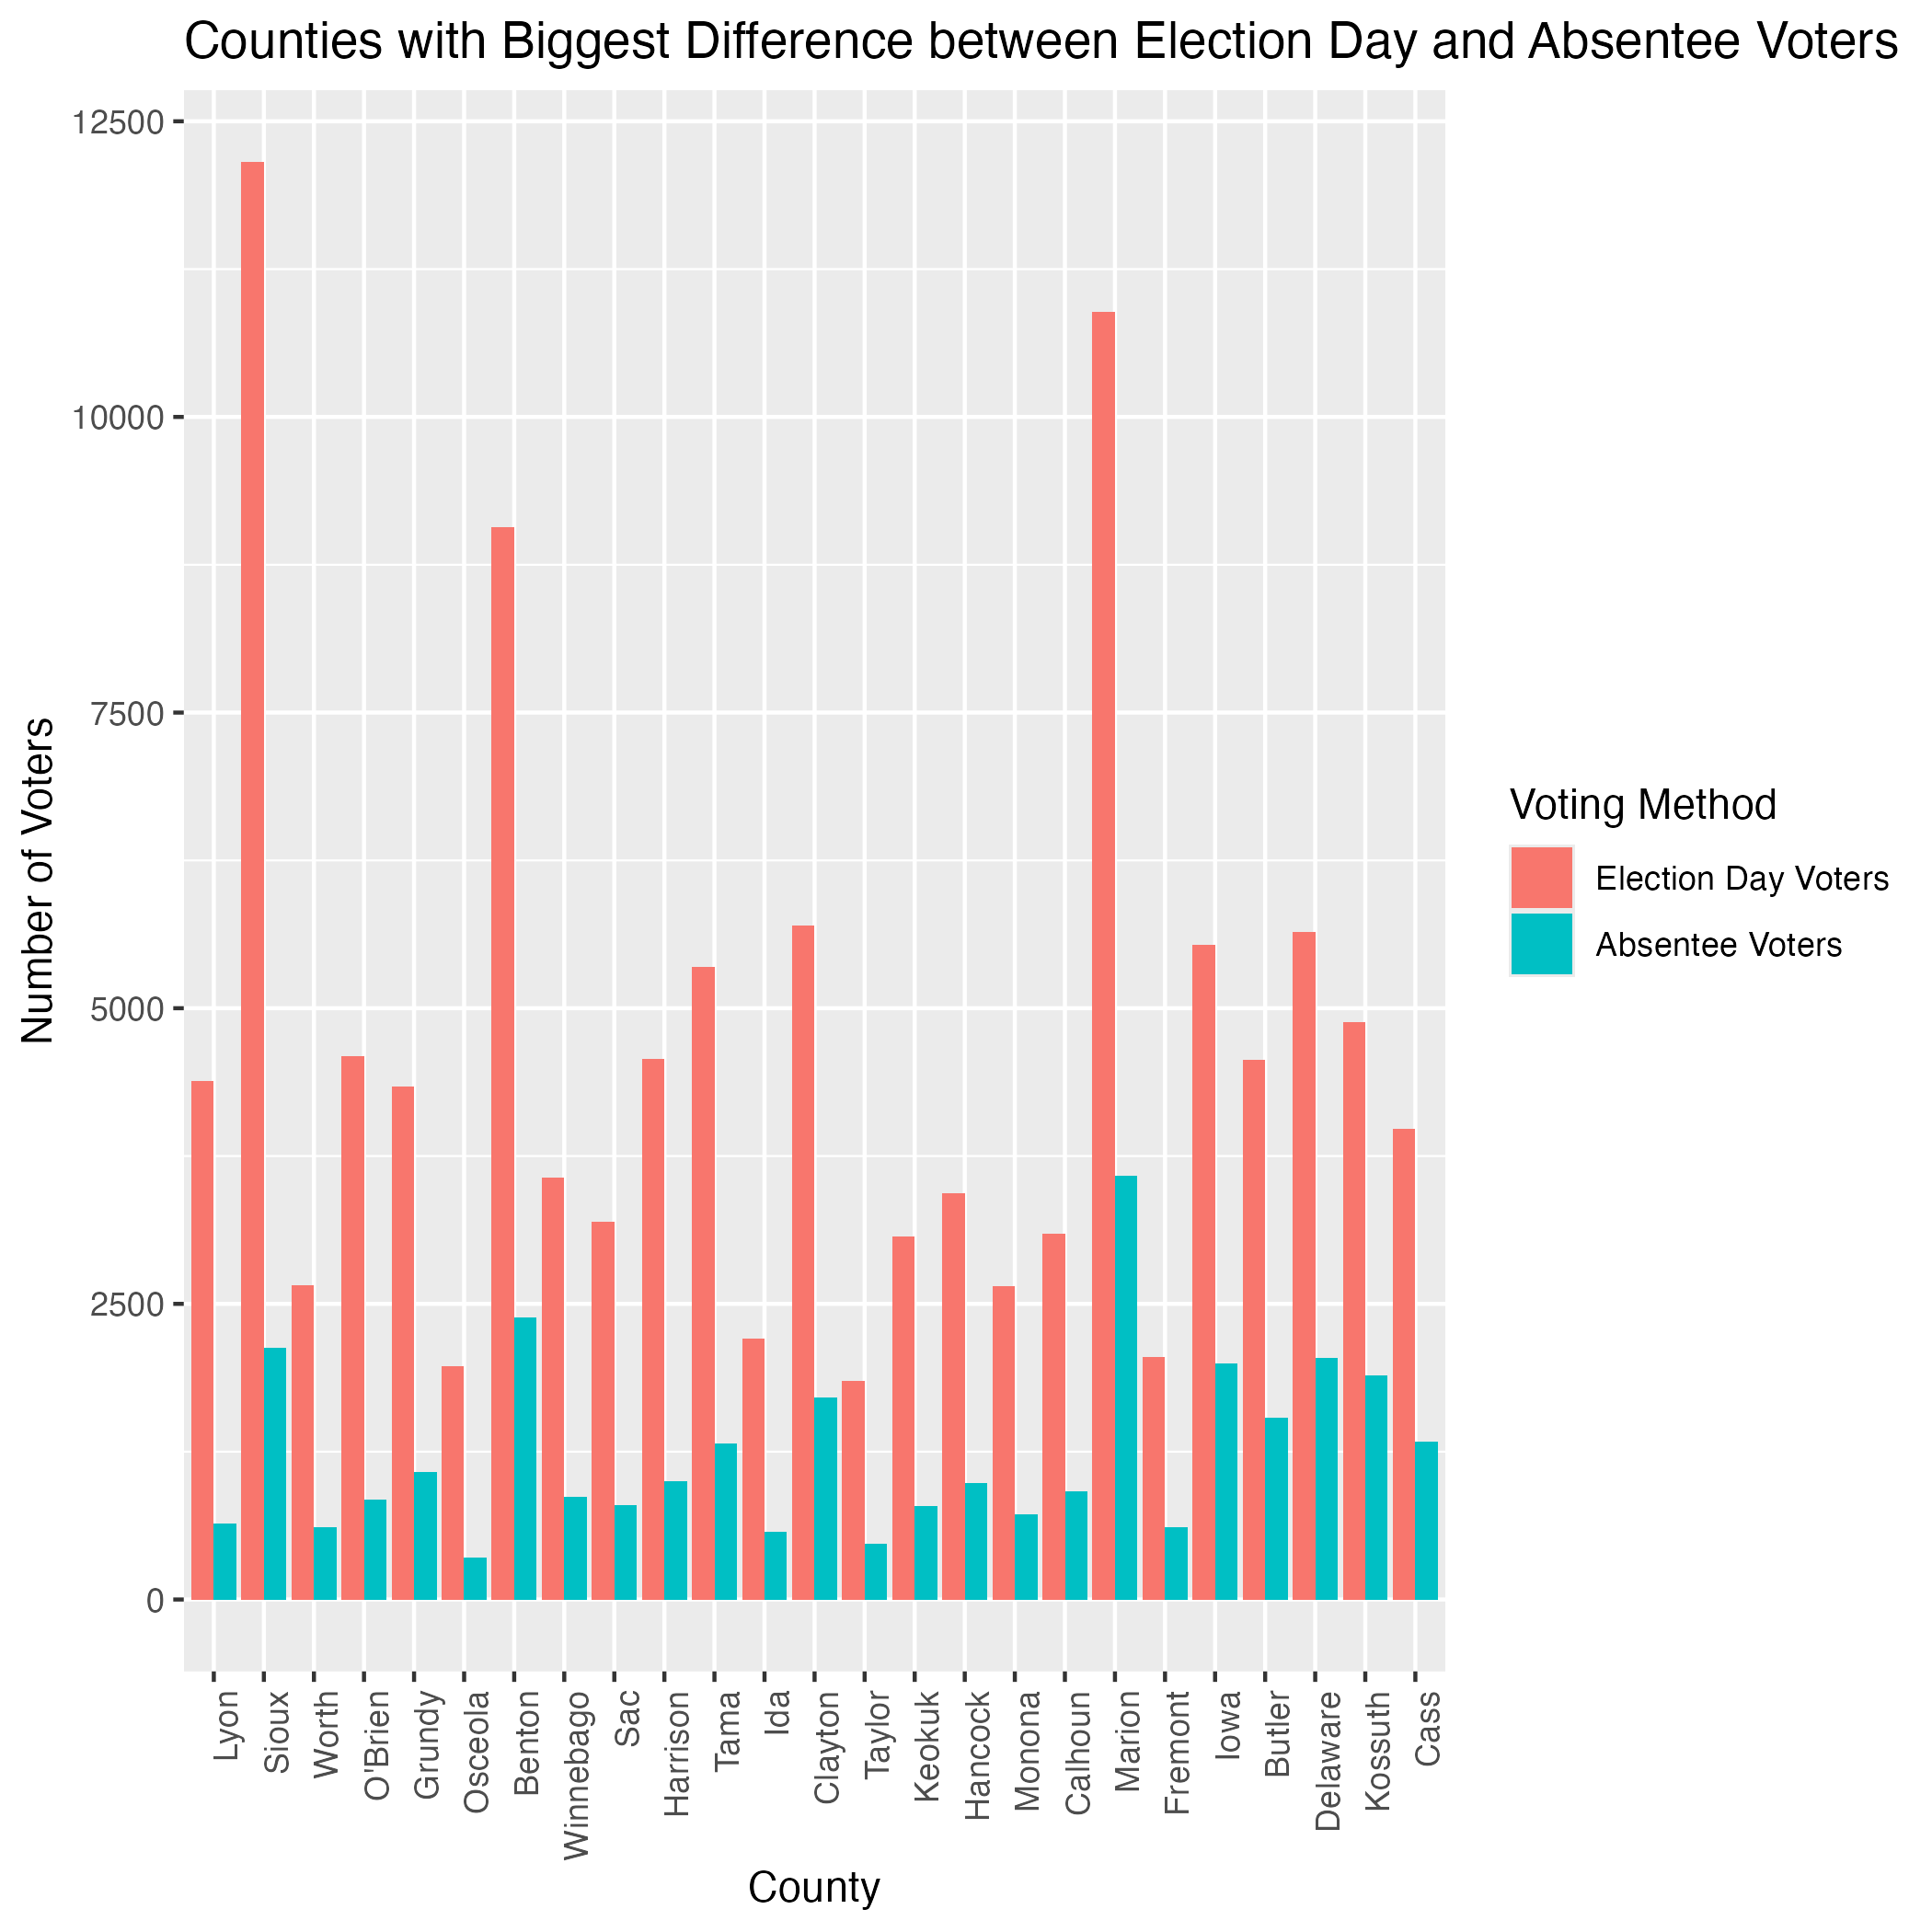
Voter Turnout Visualization
Homeland Infrastructure Foundation Datasets
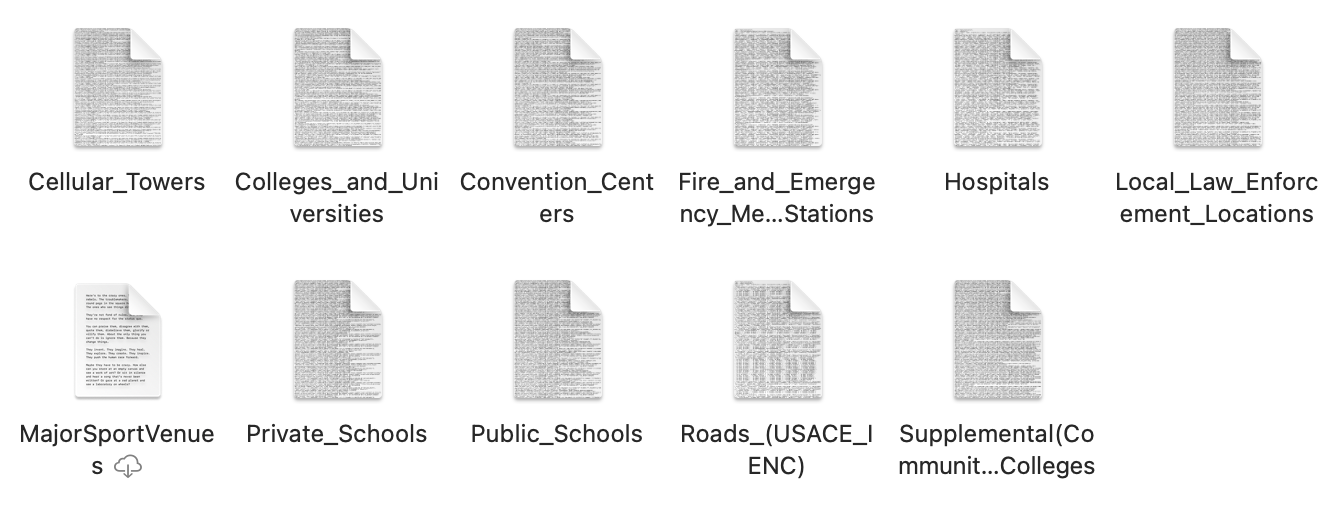
Just this one source had multiple datasets for all counties in America. Dataset includes different facilities and infrastructures which are key indicators and measures for Built Capital.
The process for this looked something like:
GEOJSON Files -> Proper Data Frame -> Data Cleaning -> Merge All Datasets
Datasets(geojson format)
Single-parent Households, Commuters & English Proficiency
We also continue on creating some visualizations and analysis for the purpose of gaining helpful insights our from clients. ### Single-parent households
Commuters (> 1 hours to work)
English Proficiency
We are trying to analyse the relationship between English proficiency with other factors such as the diversity of race, ancestry or the number of foreign entries into the state of Iowa, USA. ::: {style=“text-align: center;”}
Issues
Looking at the maps, we acknowledge that city-level data from ACS has very high margin of error, leading to very high summaries for small cities (nearly perfectly 100% of people commuting far distance, single-parent households). For example:
This makes the data unreliable.
Resolutions: Collect County-level data & Analyse the the margin of errors.
We also collect the data for English Proficiency, Commuters and Foreign-born entries. The foreign-born dataset will be used in future work to analyse the relationship with the English Proficiency.
Event Datasets: Hospital Closures, Birthing Unit Closures
Hospital Closures
After collecting and analysing ten datasets of active hospitals from 2015 to 2024, we come to a nice conclusion that there is only one closure.
Birthing Unit Closures
Two counties with two birthing unit closures. Others with zero or one.
Natural & Built Capitals
This week, we’ll start looking on the natural & built capitals (infrastructures, etc.)
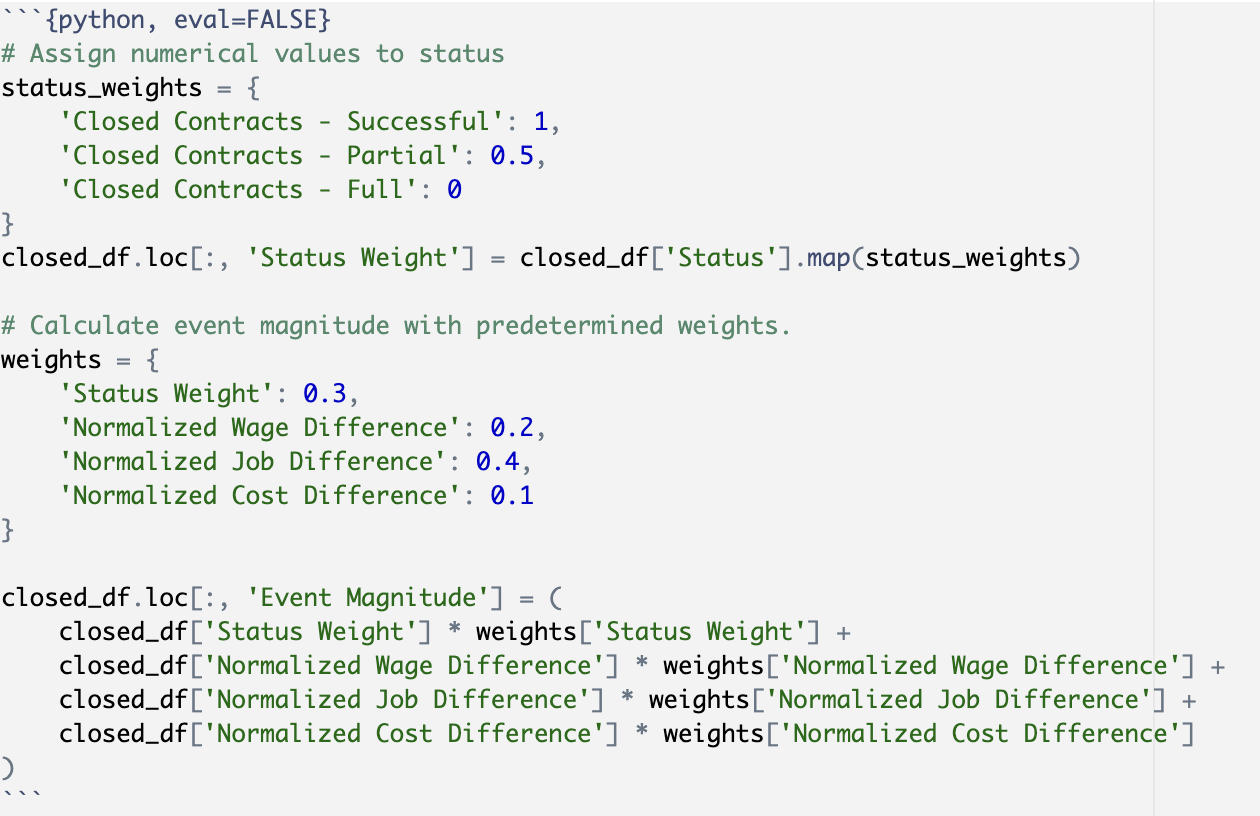
Specifically, we are looking at the number of employments in certain industries, such as: agriculture, forestry, fishing and hunting, mining. This dataset comes from the ACS and will be used as a measure for natural capitals.
