Introduction
This week, our focus shifted towards zoning codes to achieve our goal of coding data for 100 cities by July 26th. To gain deeper insights, we also met with a Cedar Rapids city zoning council member to discuss key aspects of their zoning regulations.
Housing Permit Analysis Visualization
We’ve created a data visualization that effectively explains building permit trends across Iowa cities. The next step is to develop a written analysis accompanying the visualization. Where I will provide valuable insights into the correlations between zoning, building permits, and housing affordability in Iowa.
A focus on data collection
What does a city zoning code look like?
Most larger cities have zoning setbacks and other numerical-based regulations in a table. They also frequently provide ‘use tables’ which do what they sound like; they tell all of the different uses permitted in a zone. Larger cities tend to have between 25 to 40 zoning districts.
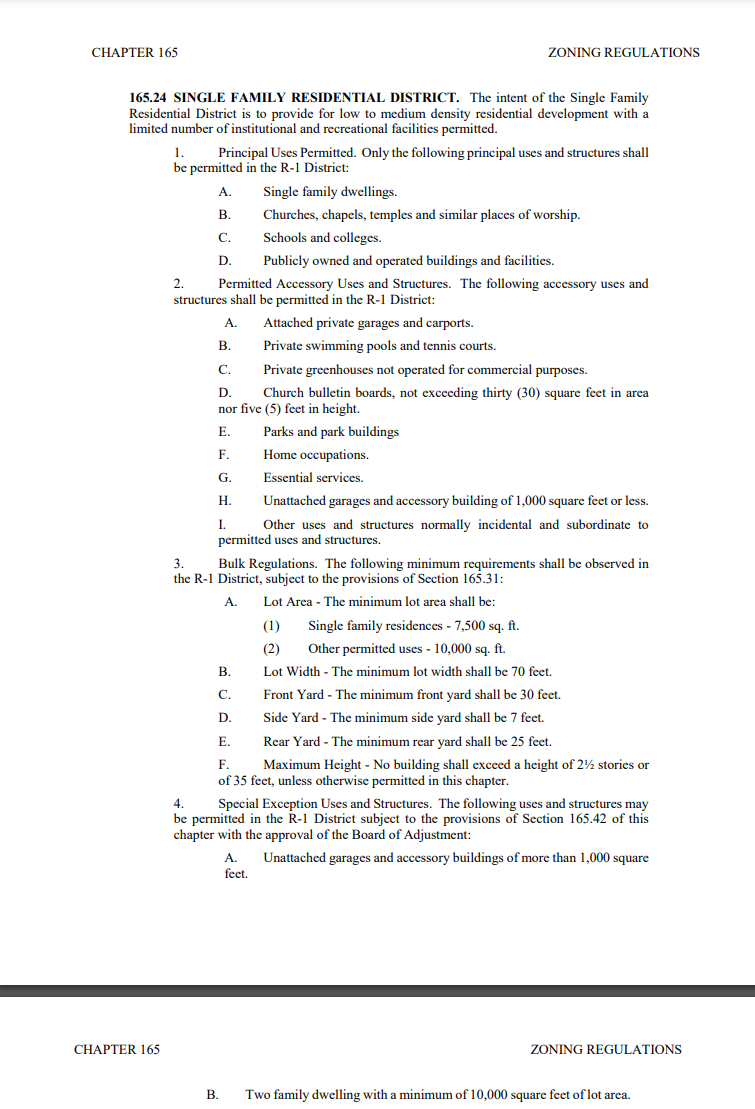
Smaller cities, however, tend to group all the information together without any tables, as there is less information to sort through. There are frequently less than 15 zoning districts for smaller cities, though we have not yet encountered a city with fewer than seven districts.
This is an example of what district code for a zone in a smaller town might look like. The example is from the zoning code of Bellmond Iowa, which is part of the MIDAS COG.

What do we look for when we’re zoning?
When we’re looking over zoning code, we focus on the residential uses permitted in that area. This includes looking at how many housing units are allowed on one lot, the type of dwelling units permitted (e.g. is a tiny house permitted?), and whether or not the district allows both residential and commercial uses.
Once we’re looking at a specific district, we can encode requirements for setbacks (aka, how far the building has to be from the property line), lot area, parking requirements, number of bedrooms, unit area, landscaping, and much more.
How much have we mapped?
We are becoming faster at encoding data as we do more of it; almost a quarter of what we’ve done so far has been submitted this week. 
The map showing how many different cities has grown steadily more blue. 
How many districts have we completed?
We have completed 1,150 districts in total, with 75 cities fully completed. 