
About the Project
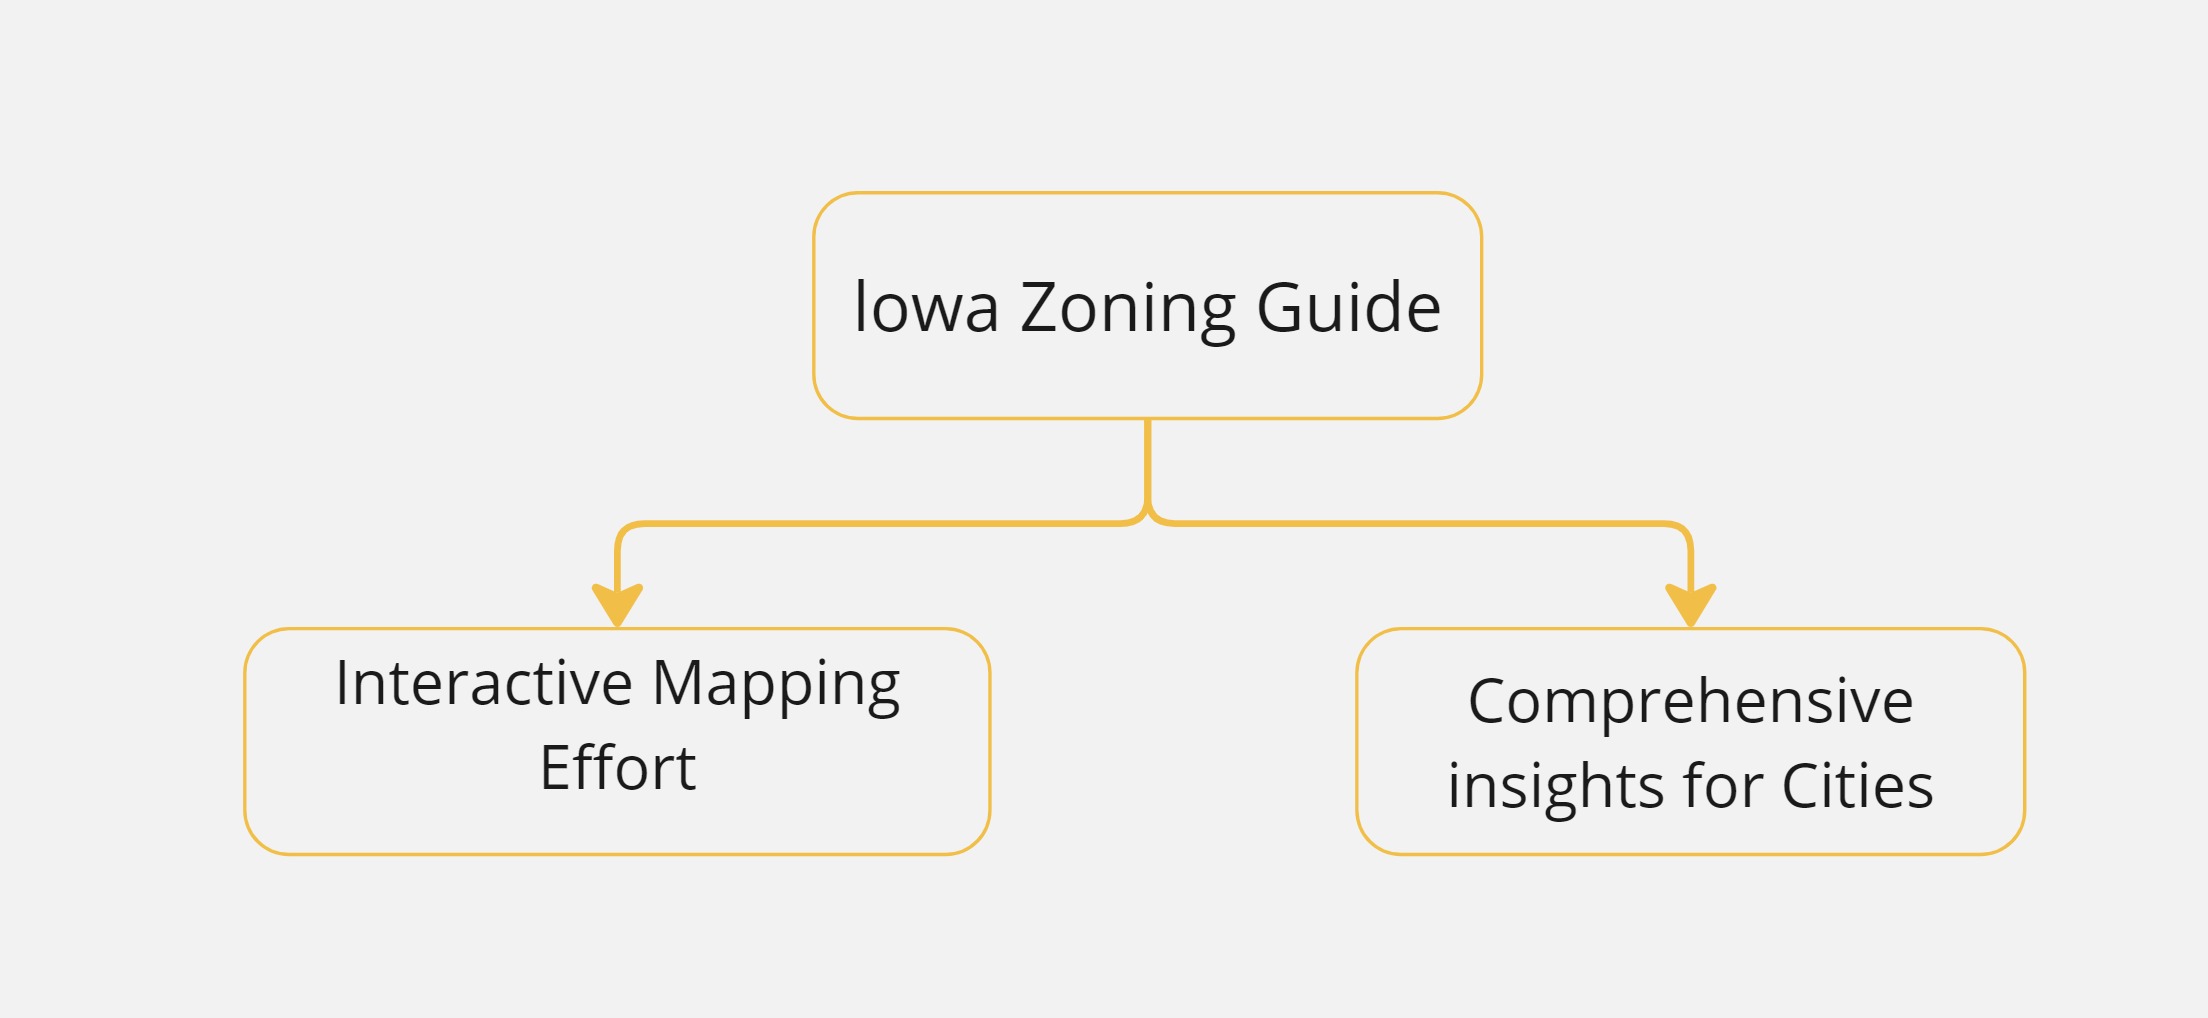
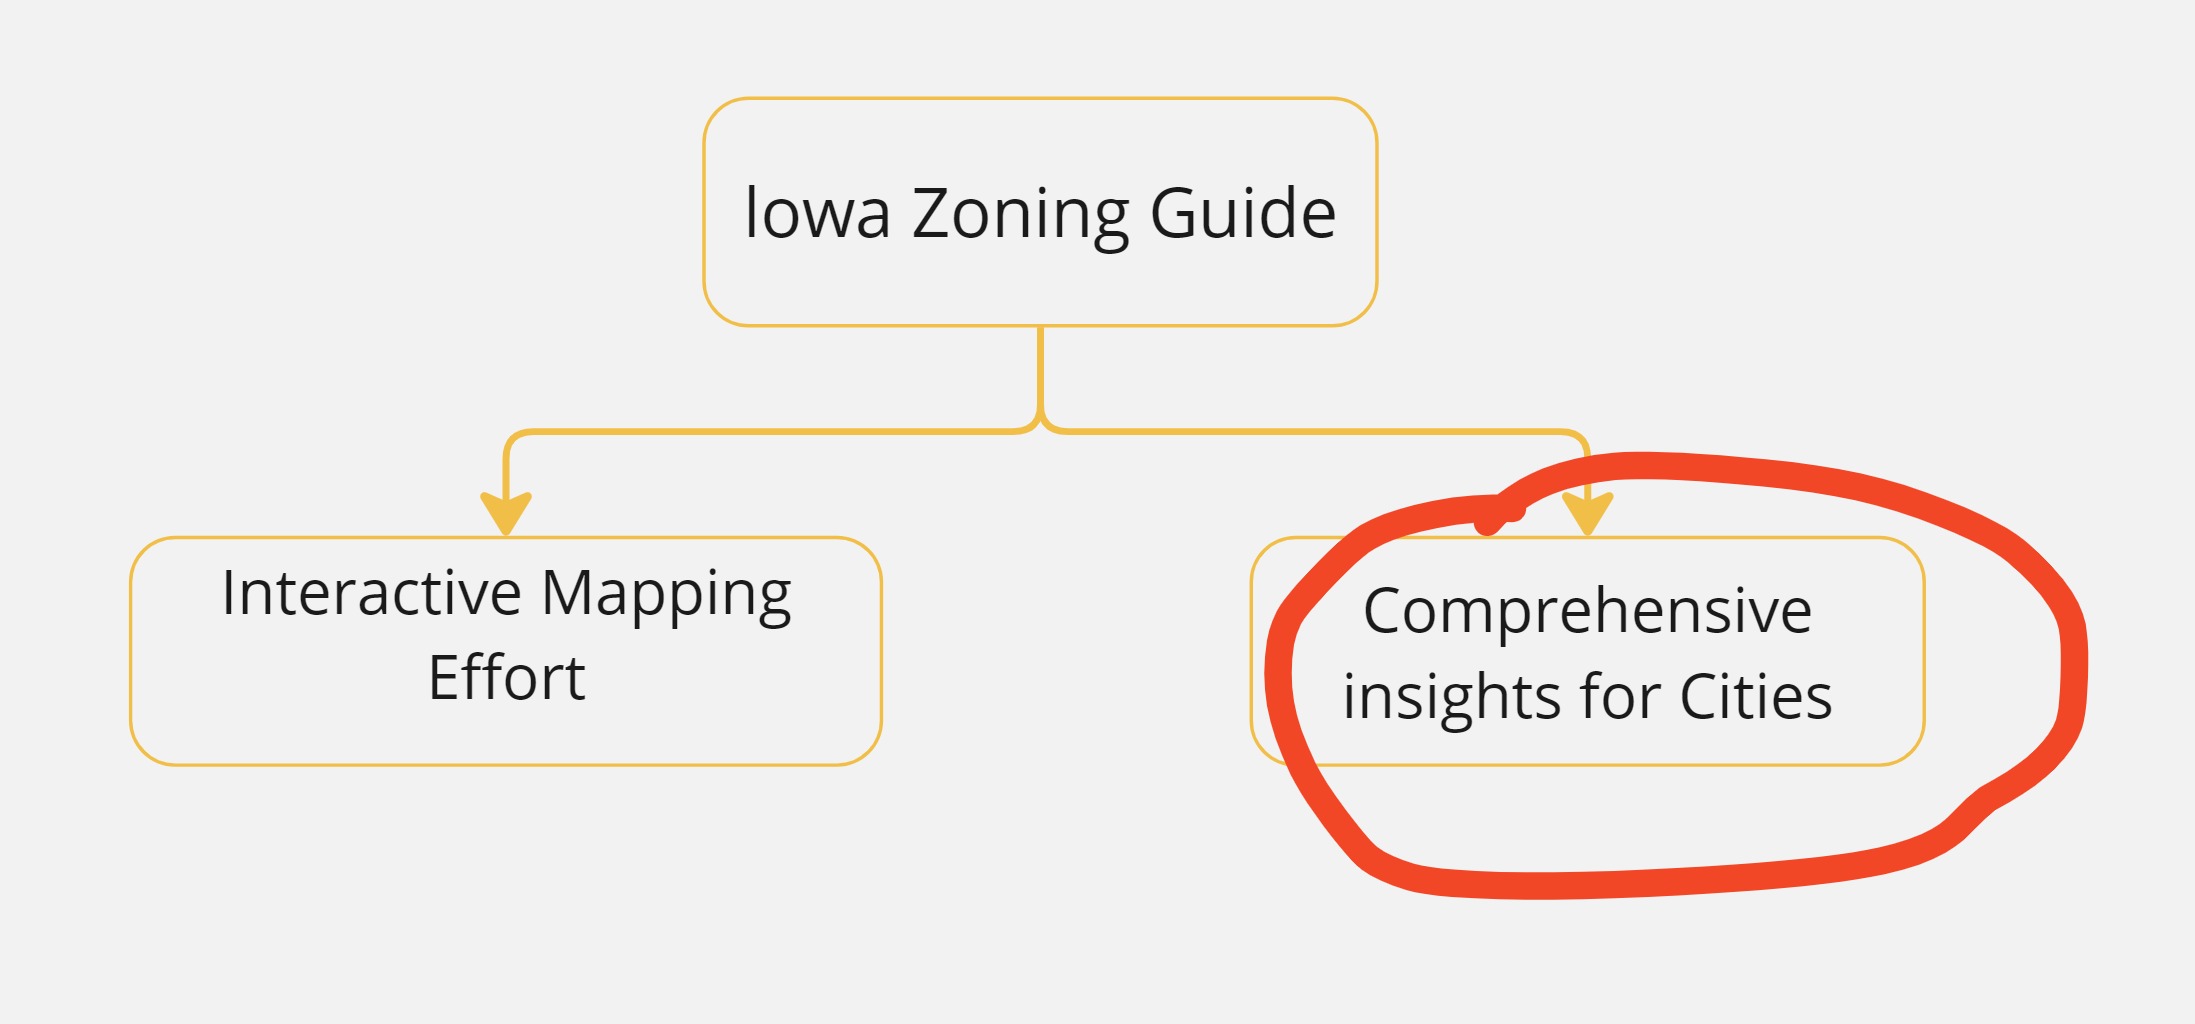
The Online Guide to lowa Zoning project is a comprehensive, interactive mapping effort that will display housing-related zoning regulations by district for 330 lowa cities.
Methodology
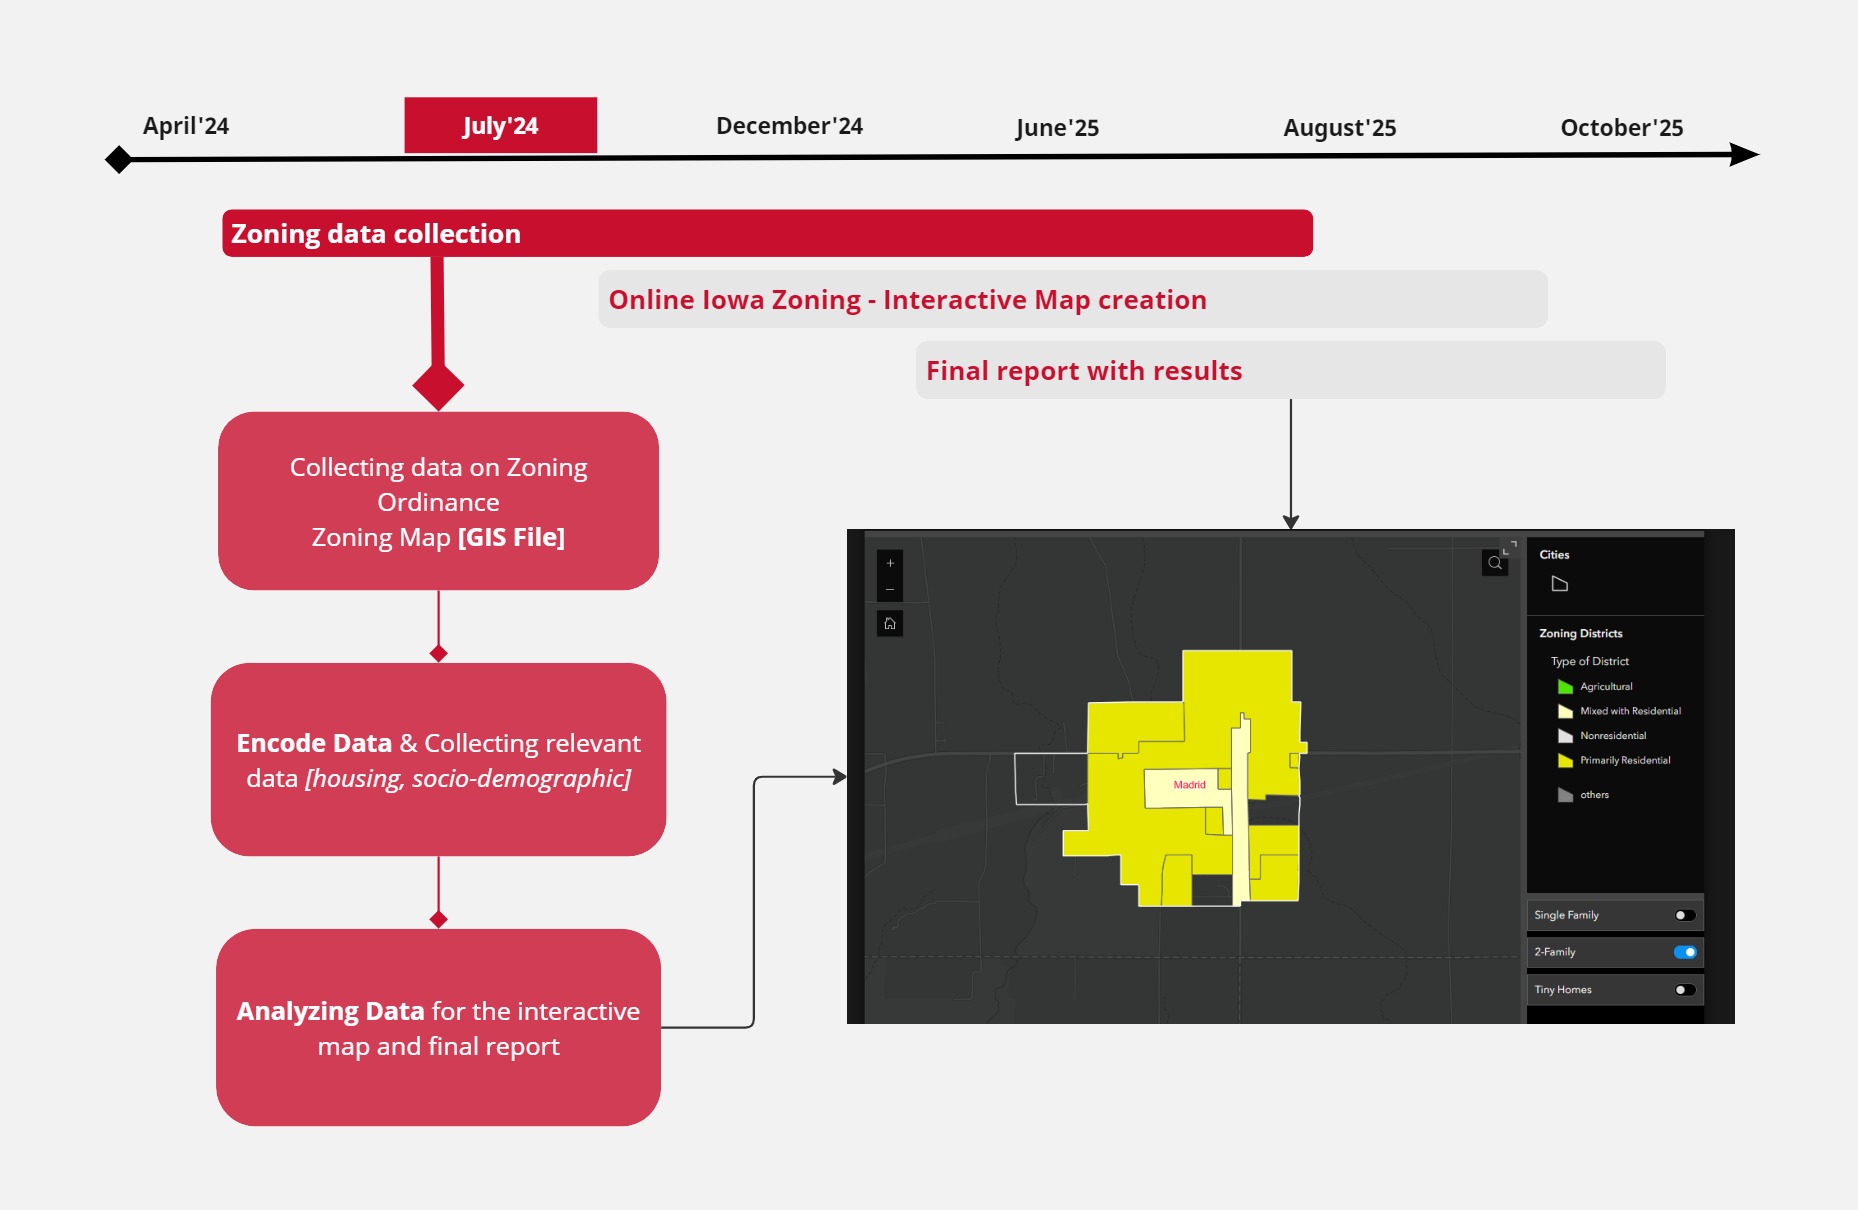
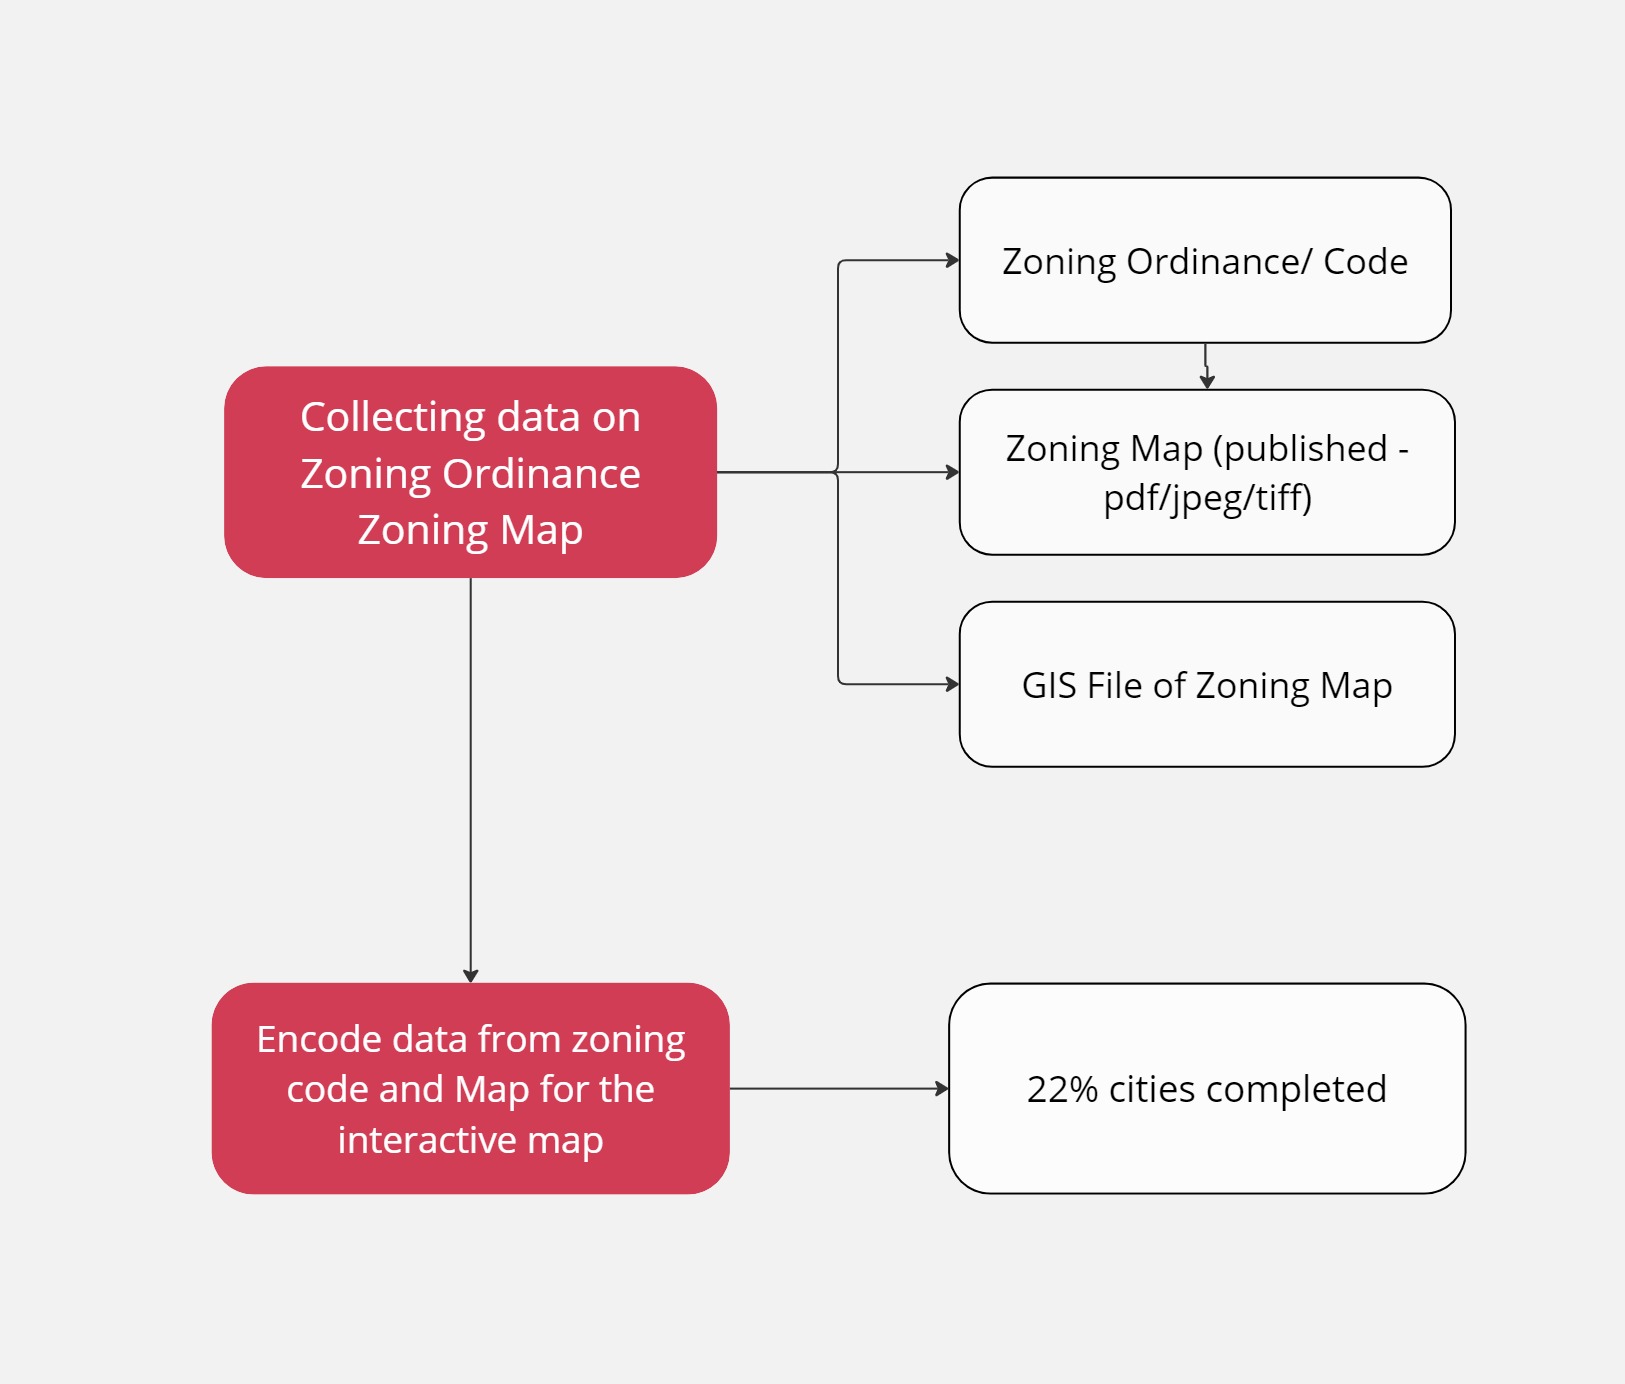
The project will collect the zoning related documents and map and encode them for preparing the interactive map related to housing information.
The project will collect and analyze data on several socioeconomic factors influencing housing in these cities.
Final Deliverables
The data collected and encoded from zoning code will be used to build the Online Guide to lowa Zoning map, which is an interactive map.
Alongside it will provide comprehensive insight into the factors affecting the production and preservation of housing across lowa.
To know more about the project and see the latest updates, visit the website
Defining Zoning before moving forward
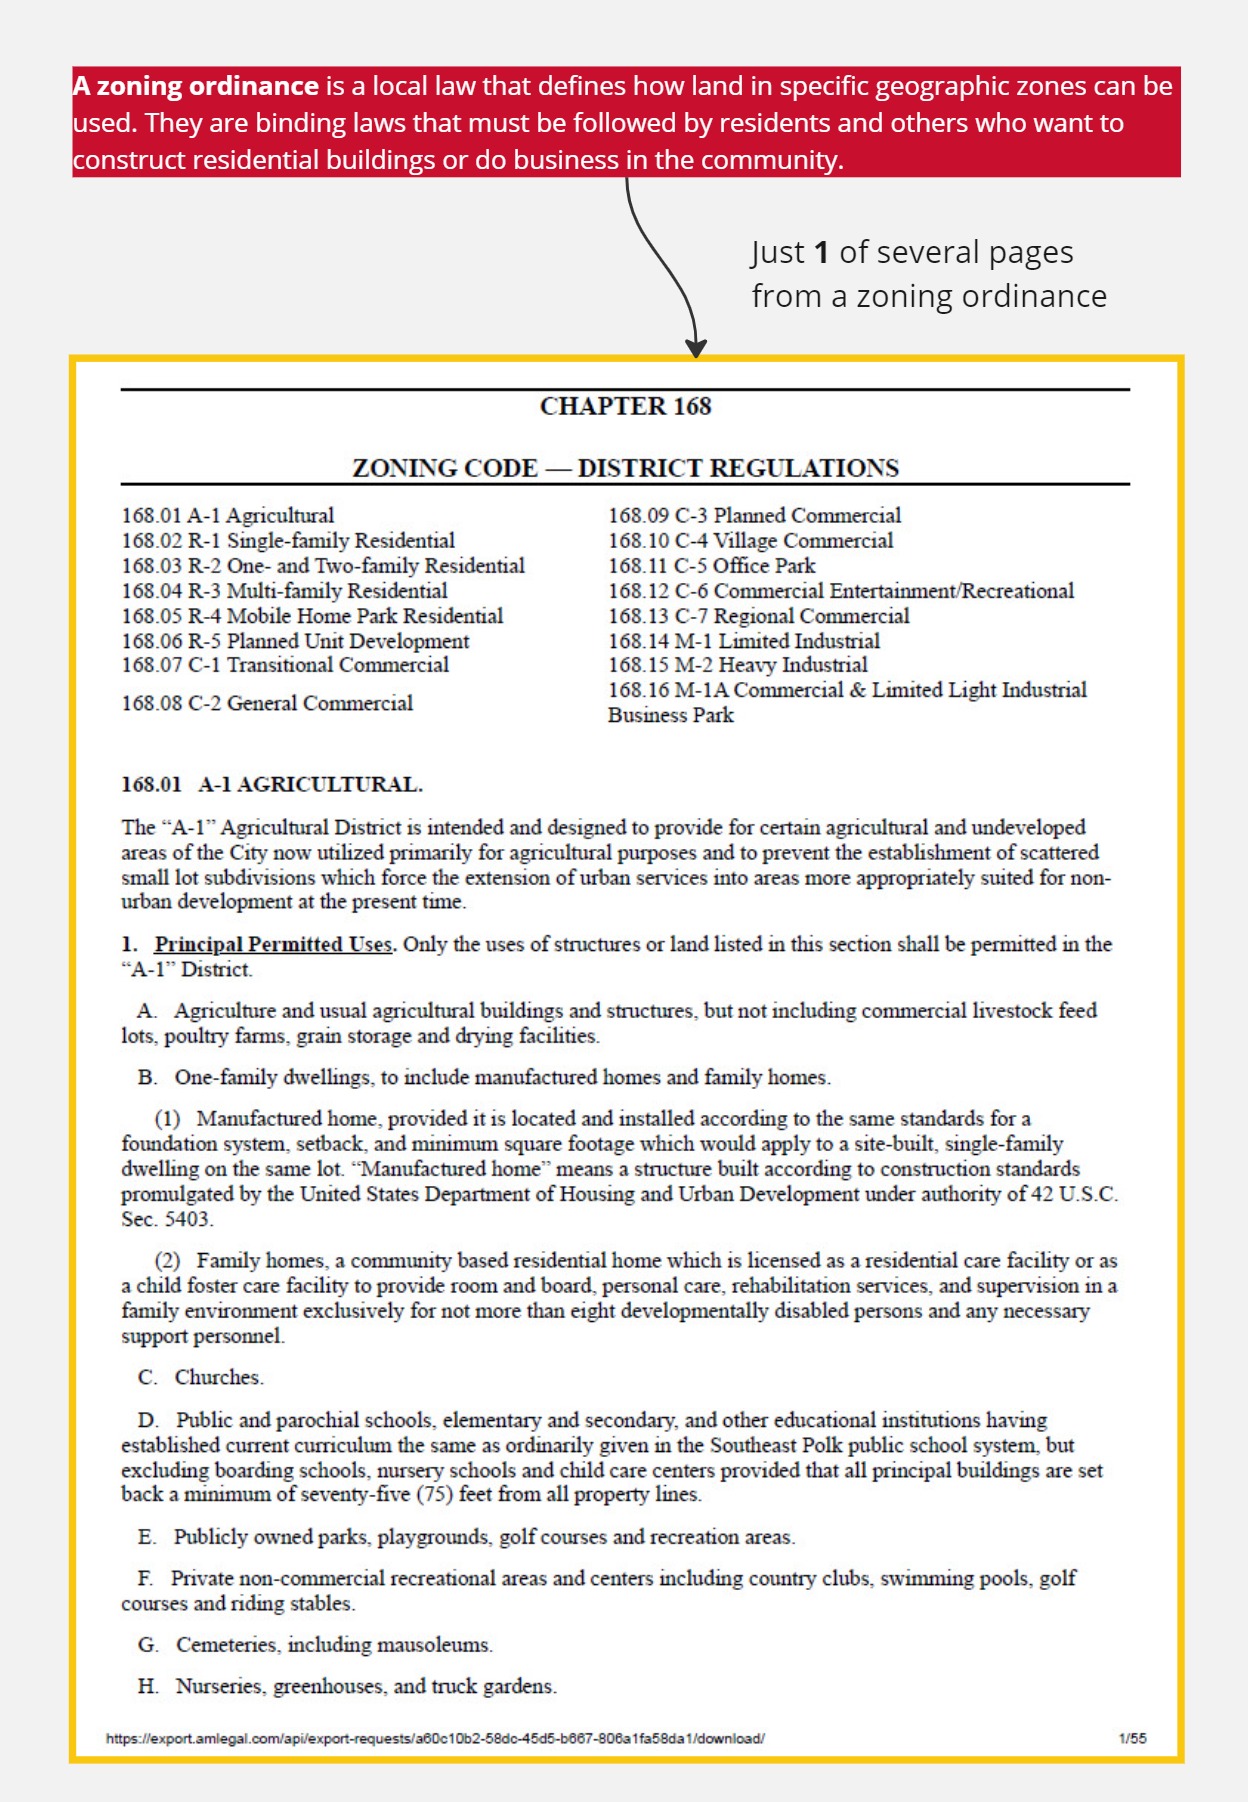
Zoning is a legislative act that divides a jurisdiction’s land into sections and regulates how each section can be used e.g for residential, commercial, industrial, agricultural etc.
Project’s Segment
There are 2 parts of the entire project - 1) Interactive Mapping of Housing-related zoning regulations 2) Comprehensive insights for the Cities
Project Timeline
Before going further into the project work is it important to note the project timeline-
Interactive Mapping Effort
Process Followed
The focus of this section is the methodology we are following to deliver the result in the October of 2025. So, for this section, we will explain our process and mark the progress we have made so far, to ensure we are on track.
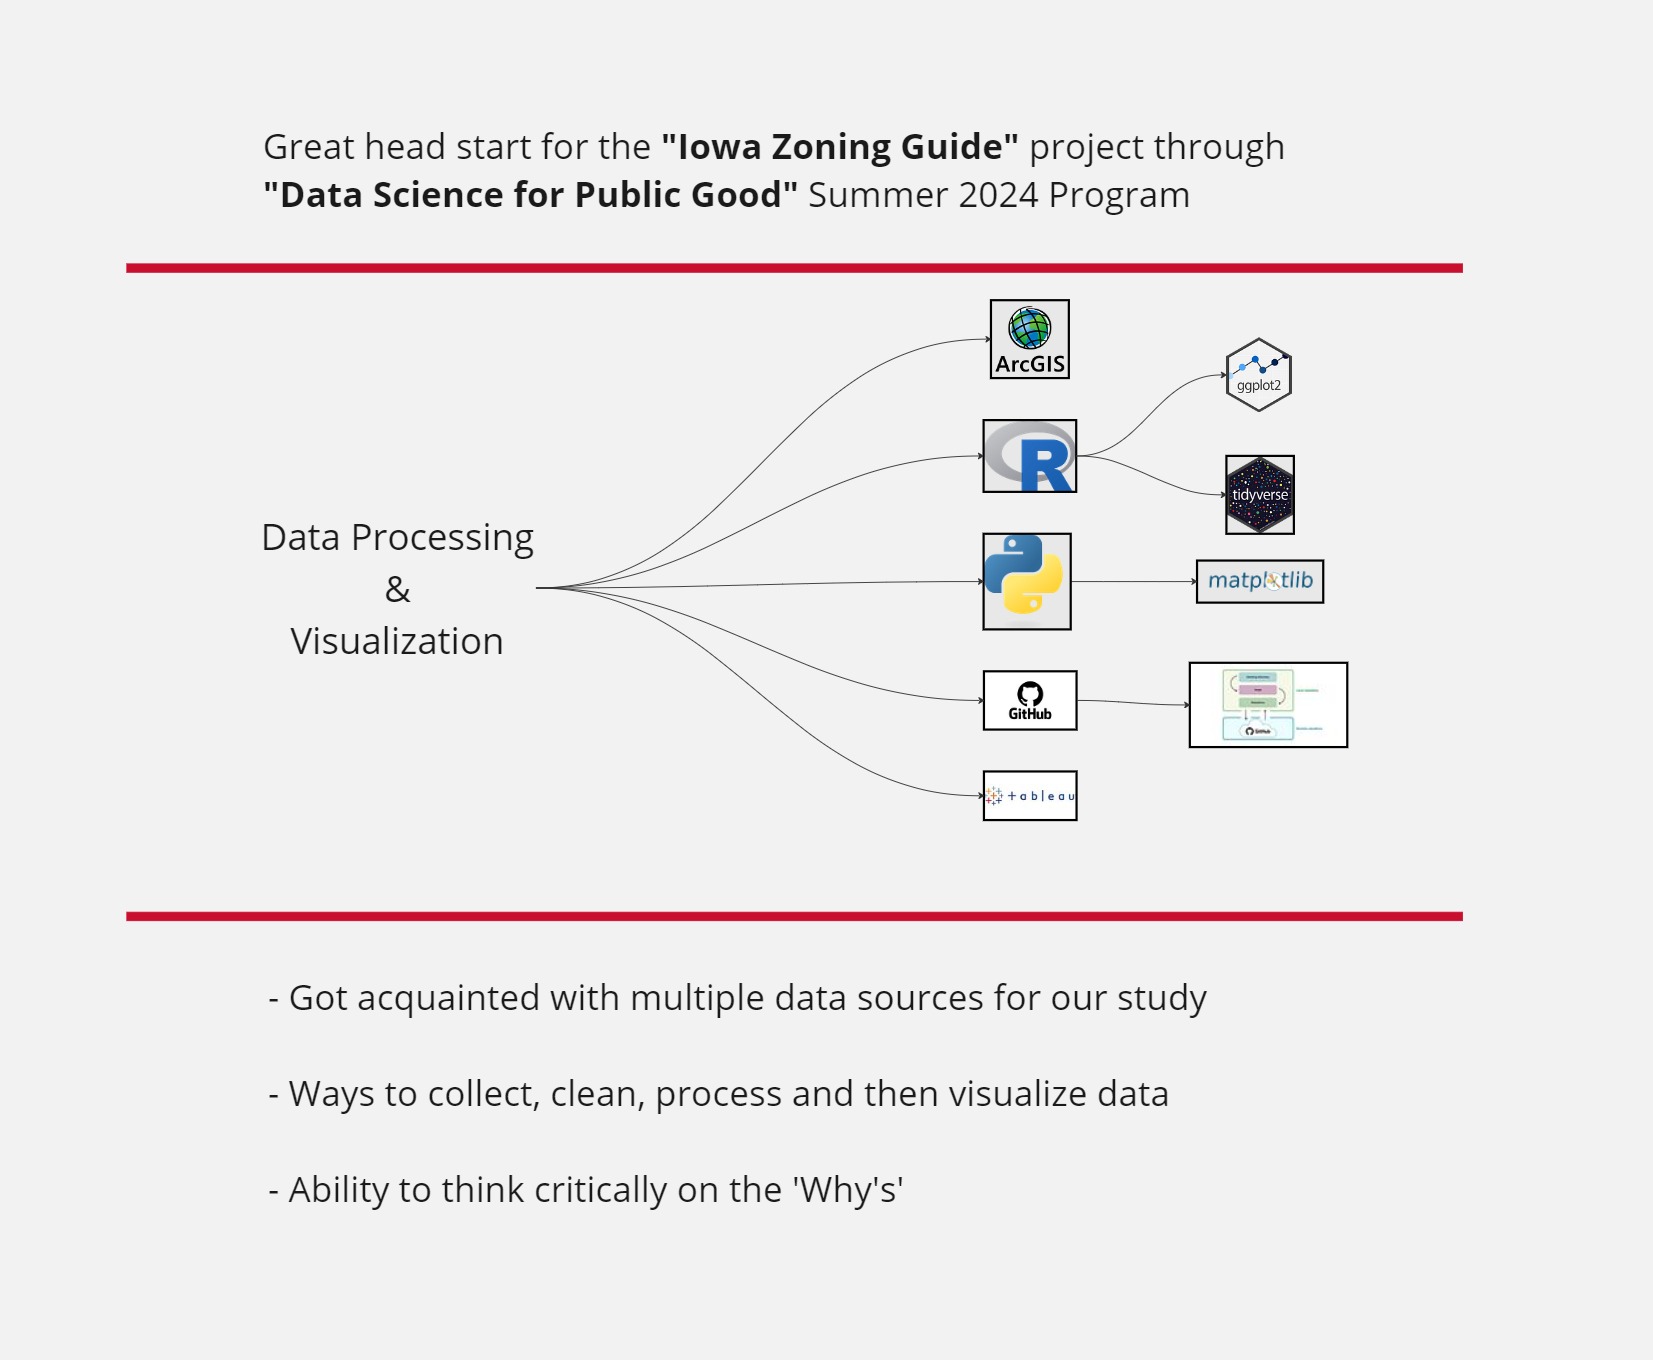
DSPG Contribution
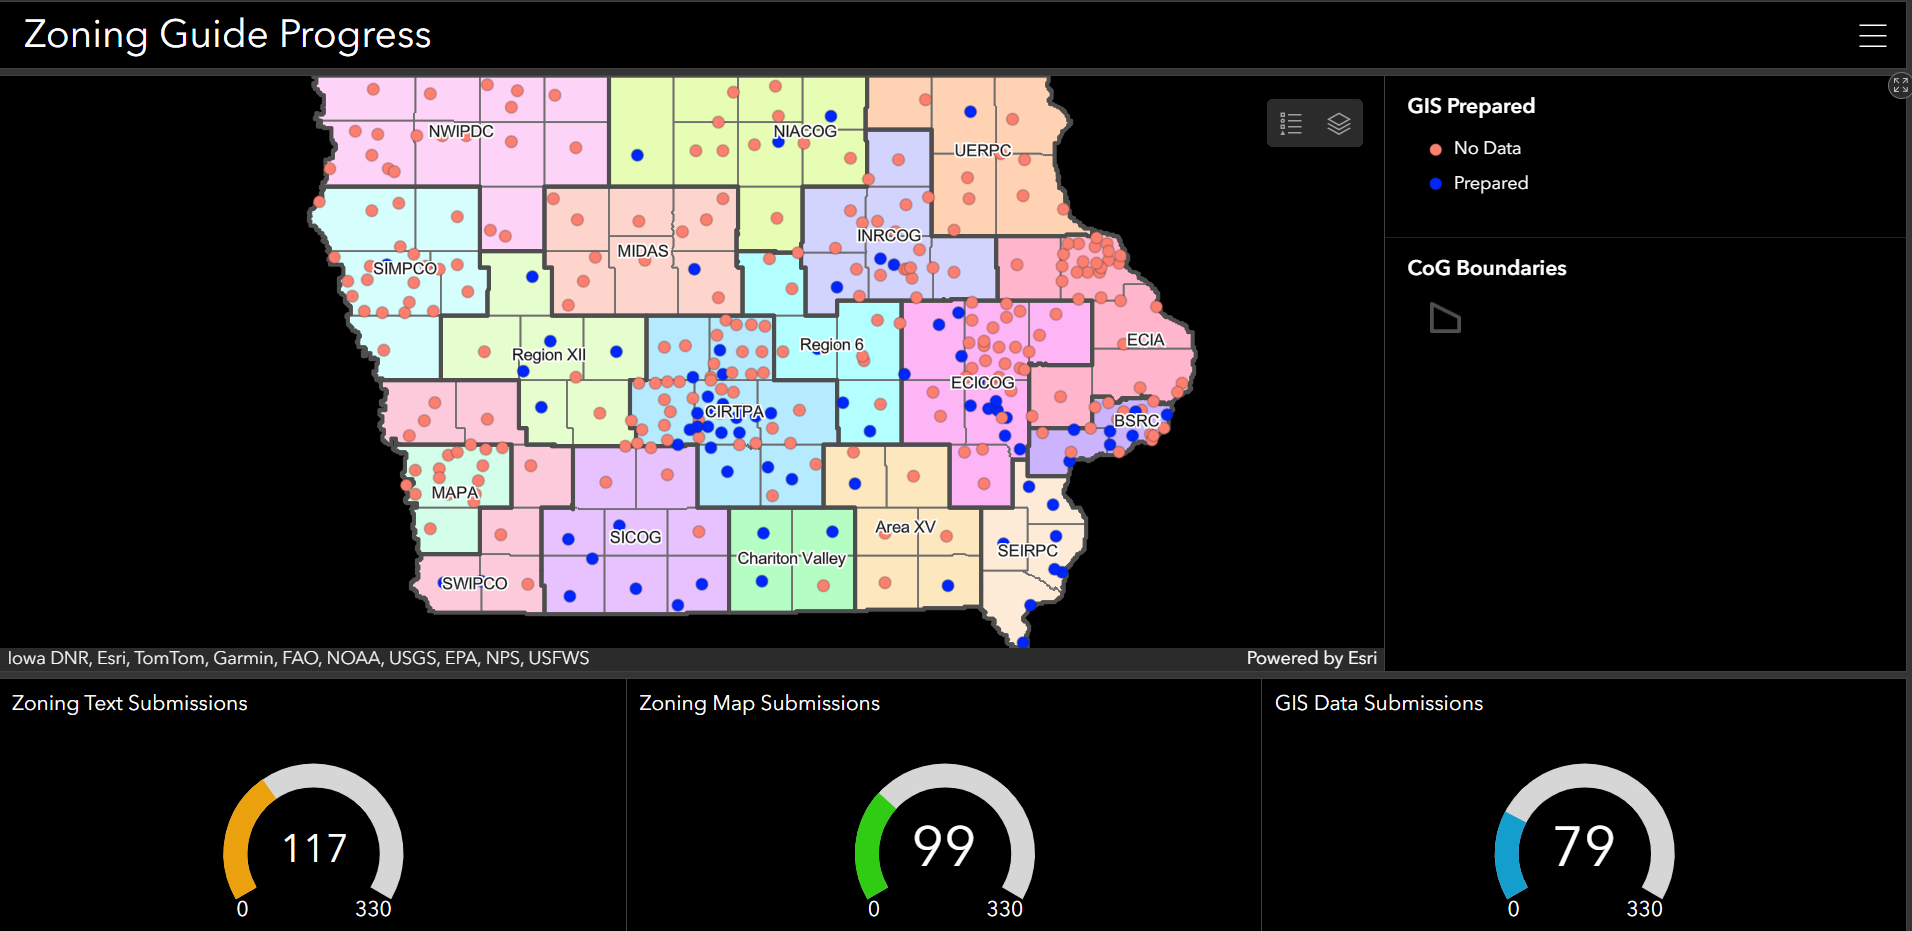
Tracking Mechanism
We are tracking each of the progress in our dashboard as shown -
Final Deliverable of Segment-1
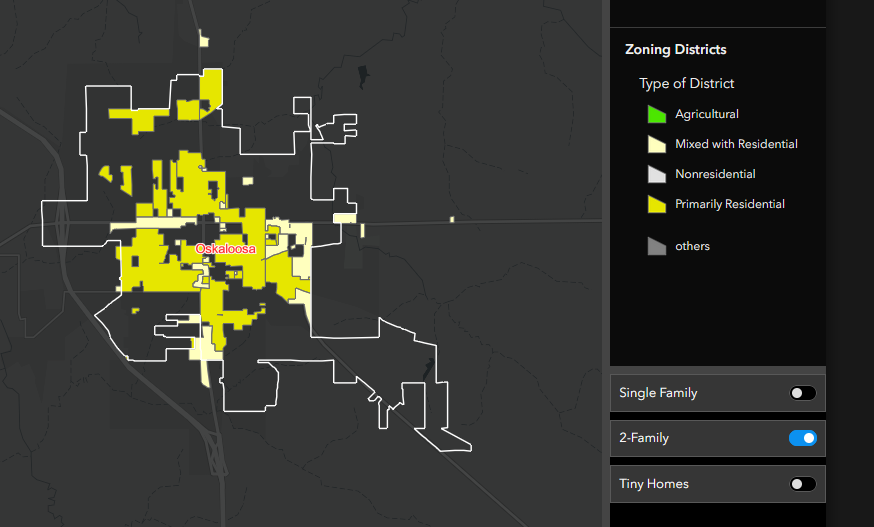
After completion of the encoding and collection of GIS final, the project team will deliver an interactive map for cities in consideration.
Example of interactive Map
Comprehensive Insights of the Cities
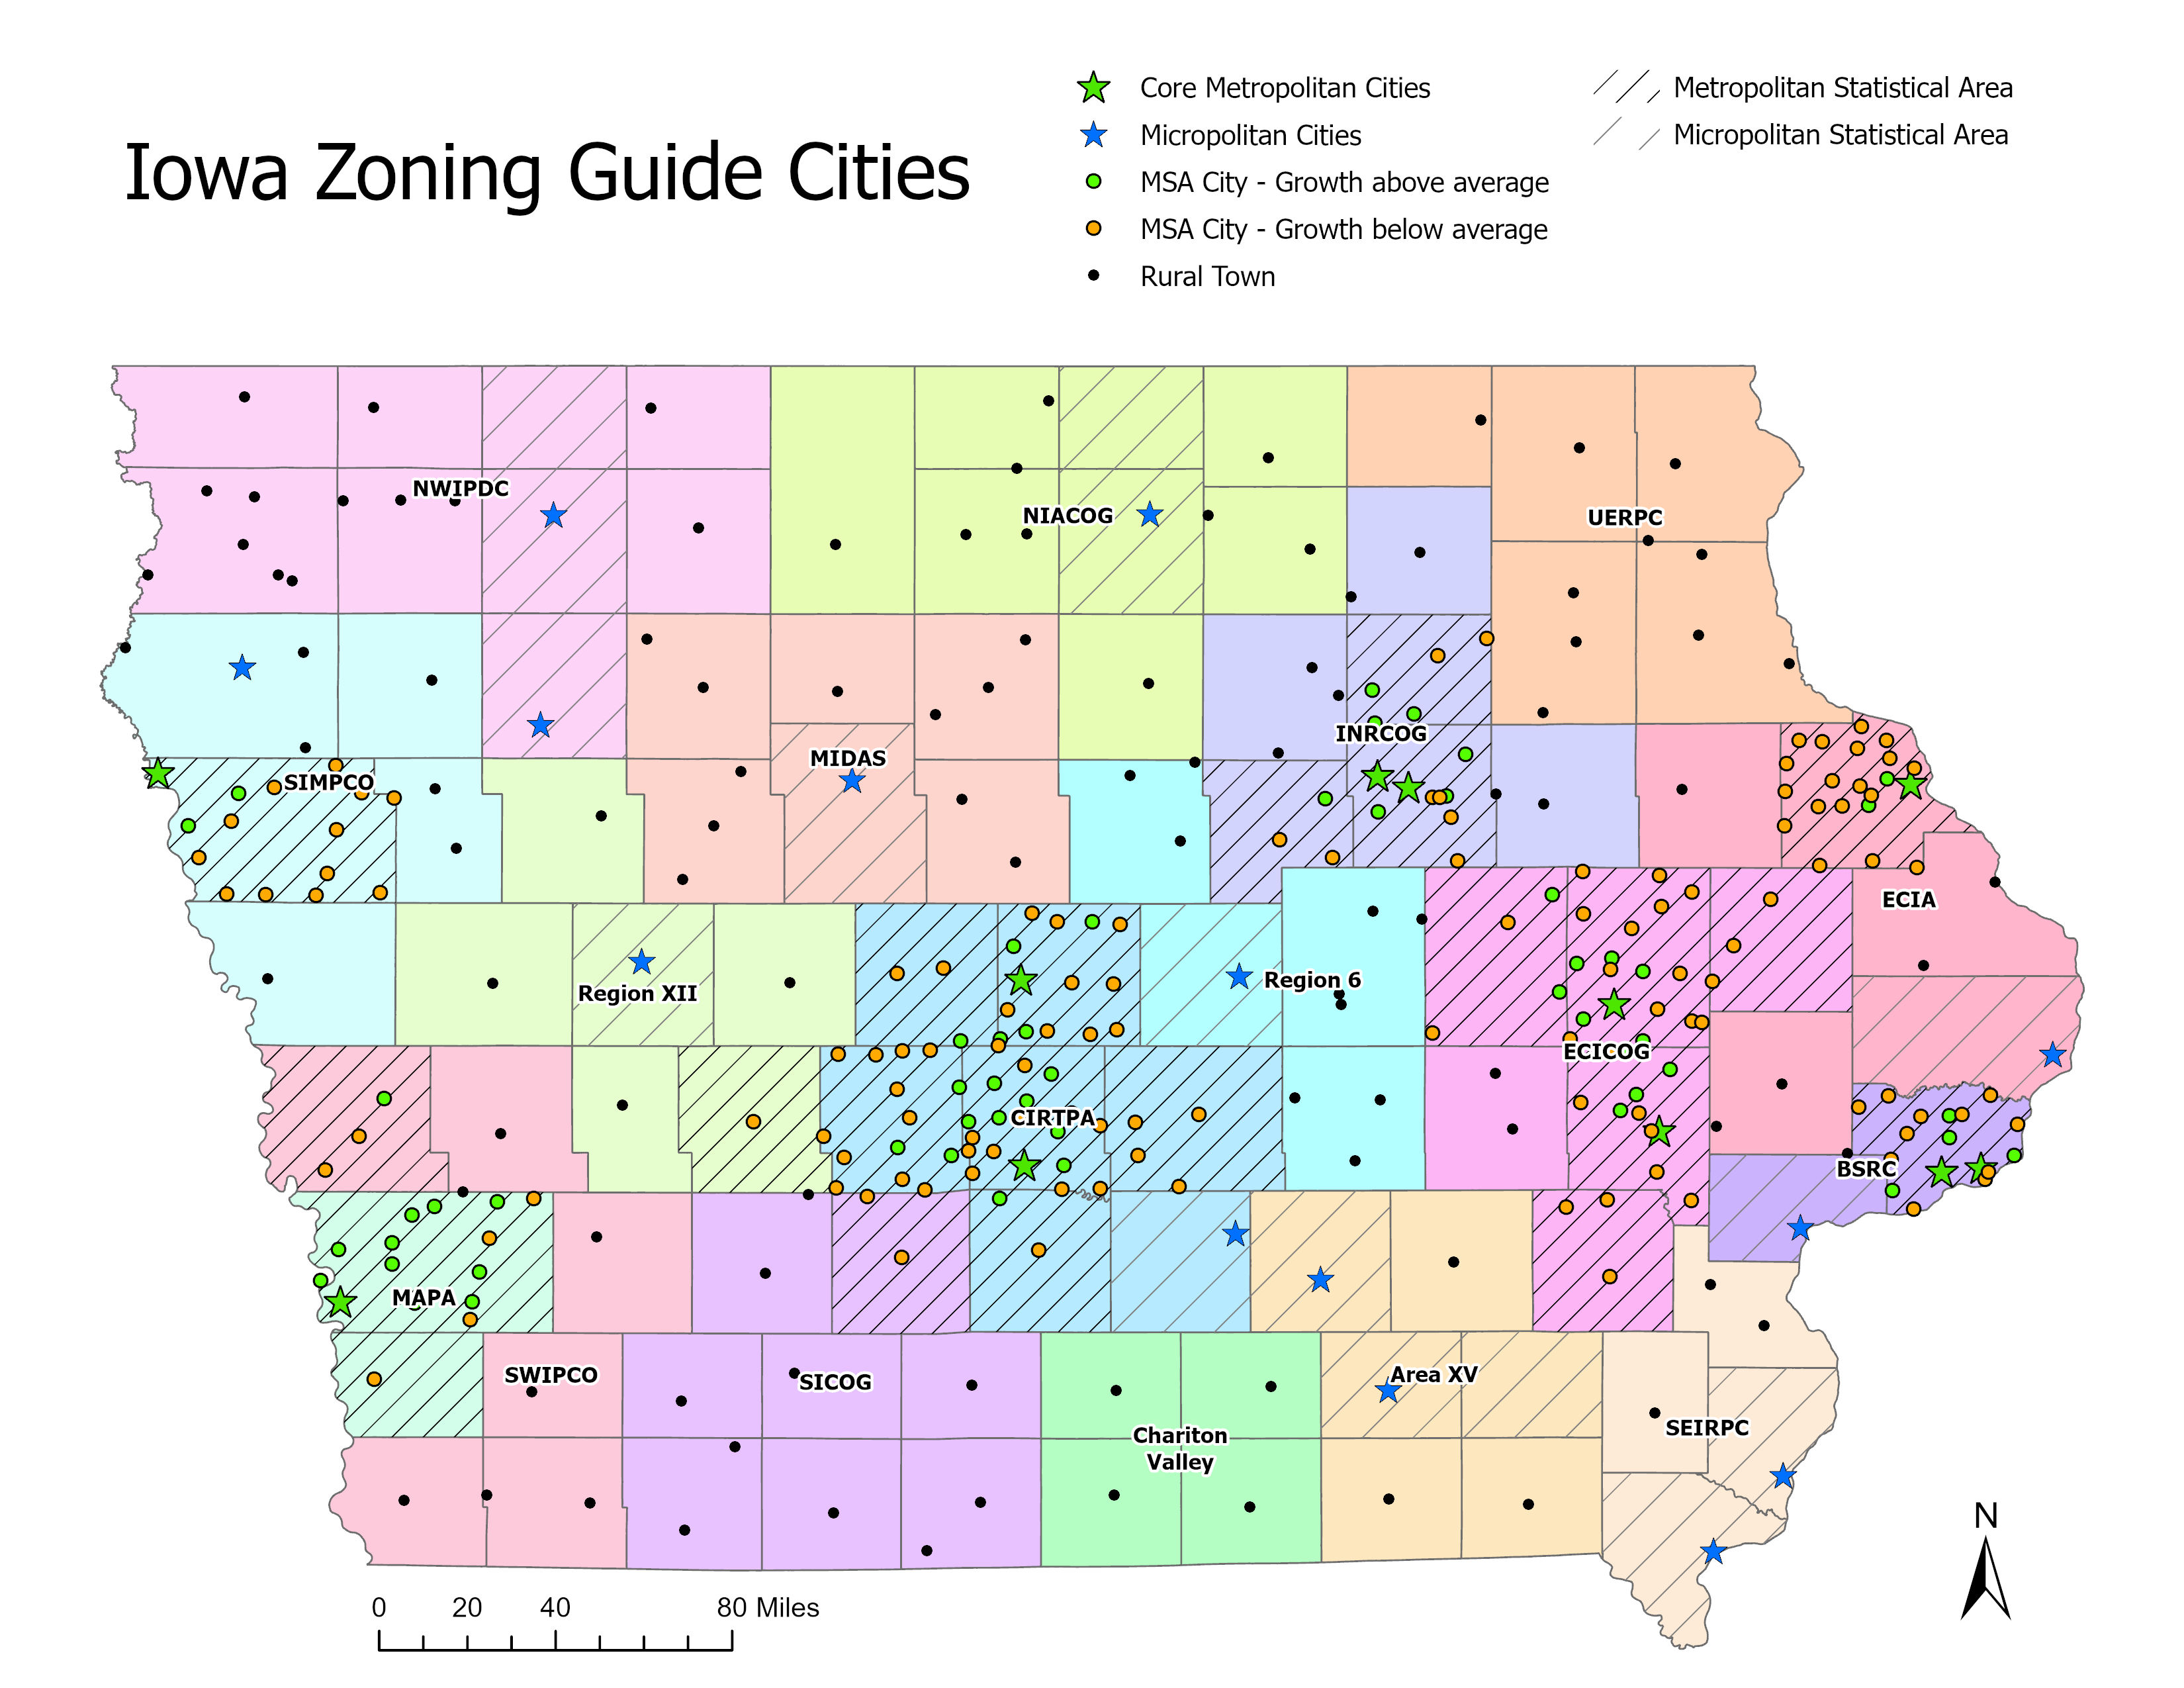
Another important aspect of the project is to share insights on different socio-demographic and housing factors, supposedly affecting the housing in Iowa State. As mentioned earlier we are working 330 cities so far, for the ease understanding the case for the cities, we have categorized the cities in 5 groups as of now.
They are
- Core Metropolitan Cities – 11 cities
- Micropolitan Cities – 14 cities
- MSA City – Growth above average – 54 cities
- MSA City – Growth below average – 121 cities
- Rural Town -130 cities
The methodology that we have followed to define the cities are as follows:
Methodology for Grouping of Cities:
Core cities: Defined as the largest city that lies within a Metropolitan designated county
MSA cities – Growth above average: Cities that lie within an MSA (excluding the core cities above) that have a growth rate above the average growth rate for the MSA in which they are located
MSA cities – Growth below average: Cities that lie within an MSA (excluding the core cities above) that have a growth rate below the average growth rate for the MSA in which they are located
Micropolitan City: Cities of 10,000+ that lie within a micropolitan Statistical Area
Rural: Åll remaining cities
To calculate (2) and (3) above: For each MSA, calculate the growth rate of the MSA cities by \[ \text{Growth Rate} = \frac{\text{2020 pop of our study cities in MSA} - \text{2000 pop of our study cities in MSA}}{\text{2000 pop of our study cities in MSA}} \]
Study cities in (2) will be all those with growth rates above the average growth rate just calculated for the MSA where they are located
Study cities in (3) will be all those with growth rates below the average growth rate just calculated for the MSA where they are located
Beginning of Exploration
From the beginning of the project, we have focused on assessing and determining parameters that will give us insights into the city’s condition related to its housing and then associated with the zoning. Given the phase we are at of our overall project timeline, after the initial exploration of multiple and diverse range of parameters we have decided to focus on 2 avenues for now they are Affordability and Employment. Our current goal is to identify and indicate the current scenario and going forward as we complete our encoding part of the zoning ordinance, we will focus on finding the correlation and come up with a recommendation from the finding, which is now parked for the first phase of the project to be completed.
Layers of this Report
The analysis presented in this report are presented for specific cities or grouping of cities. Due to the volume of data for 330 cities for multiple number of years for trend analysis and a few number of variables dealt with in this report, all the data are stored in a dashboard format for view by selecting desired cities, years and variables. So, even if your desired city is not in this report, you are still able to identify the scenario for your city with the links shared at the end of this blog.
Overview of Affordable Housing for Iowa
The housing crisis has been a much-talked topic in the past years, with rising population size and it is a constant need to ensure housing for the people living in the states. Here in Iowa the homelessness value is at 7.6 people per 10,000 of the state population (2,419 people) U.S. Department of Housing and Urban Development, Stebbins (2023). With this percentage Iowa state is the 5th state from the bottom, which is good news for the residents. But this number only shows that the state is not on the verge of extremeness and still there is hope to recover from the crisis the state is halfway. The data presented in this report further will help understand the current scenario for homeowner, renters based on their income, the market trends of housing treatment, which way the demand for the housing is going, is Iowa is in the condition of preventing it to be the crisis, ensuring quality of life for its residents to reduced mental exhaustion of worries regarding the basics of life such as their shelter in this case.
Housing Affordability for Iowa
The housing market, has been significantly impacted by recent economic trends. A surge in housing costs, coupled with rising interest rates, has made housing less affordable for many Iowans. We aim to provide insights into the current state of housing affordability in Iowa and identify potential areas for improvement.
This section of the report examines four key indicators of housing affordability:
- Homeownership rates.
- Housing and rental prices.
- Relative income levels.
- Mortgage interest rate.
Iowa Homeownership Rate
Iowans primarily reside in two housing arrangements: owning a home or renting a home. A small percentage of the population falls outside these categories. We know most people would rather own a home, so a lower homeownership rate could be an indicator that less people are able to afford a home and settling for renting.
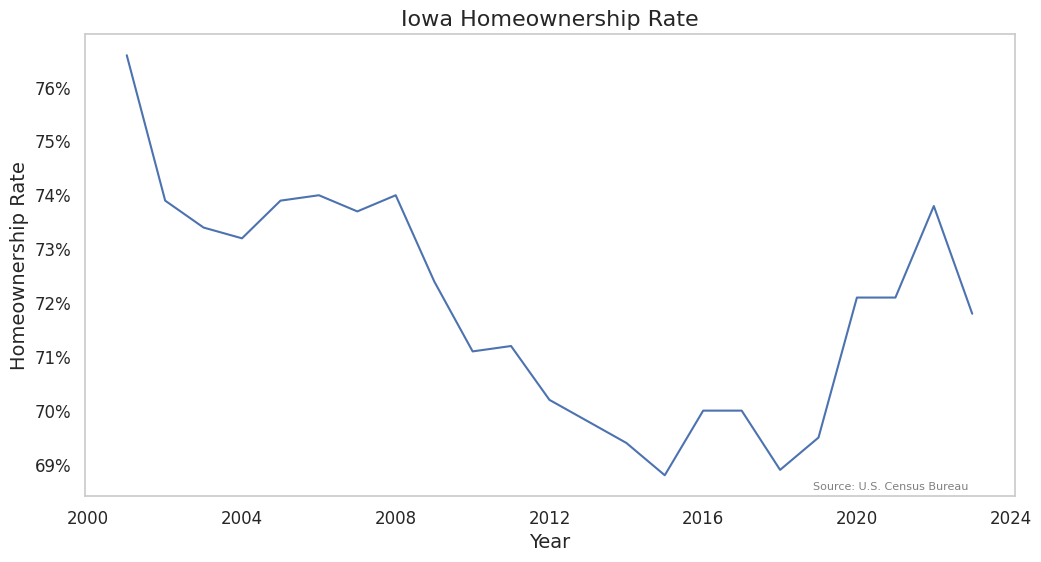
Currently, homeownership stands at 72%, a figure that, while higher than the national average of 65%, has been on a steady decline since the dot-com bubble in 2001. This trend places Iowa’s homeownership rate at a level comparable to its 1984 standing.
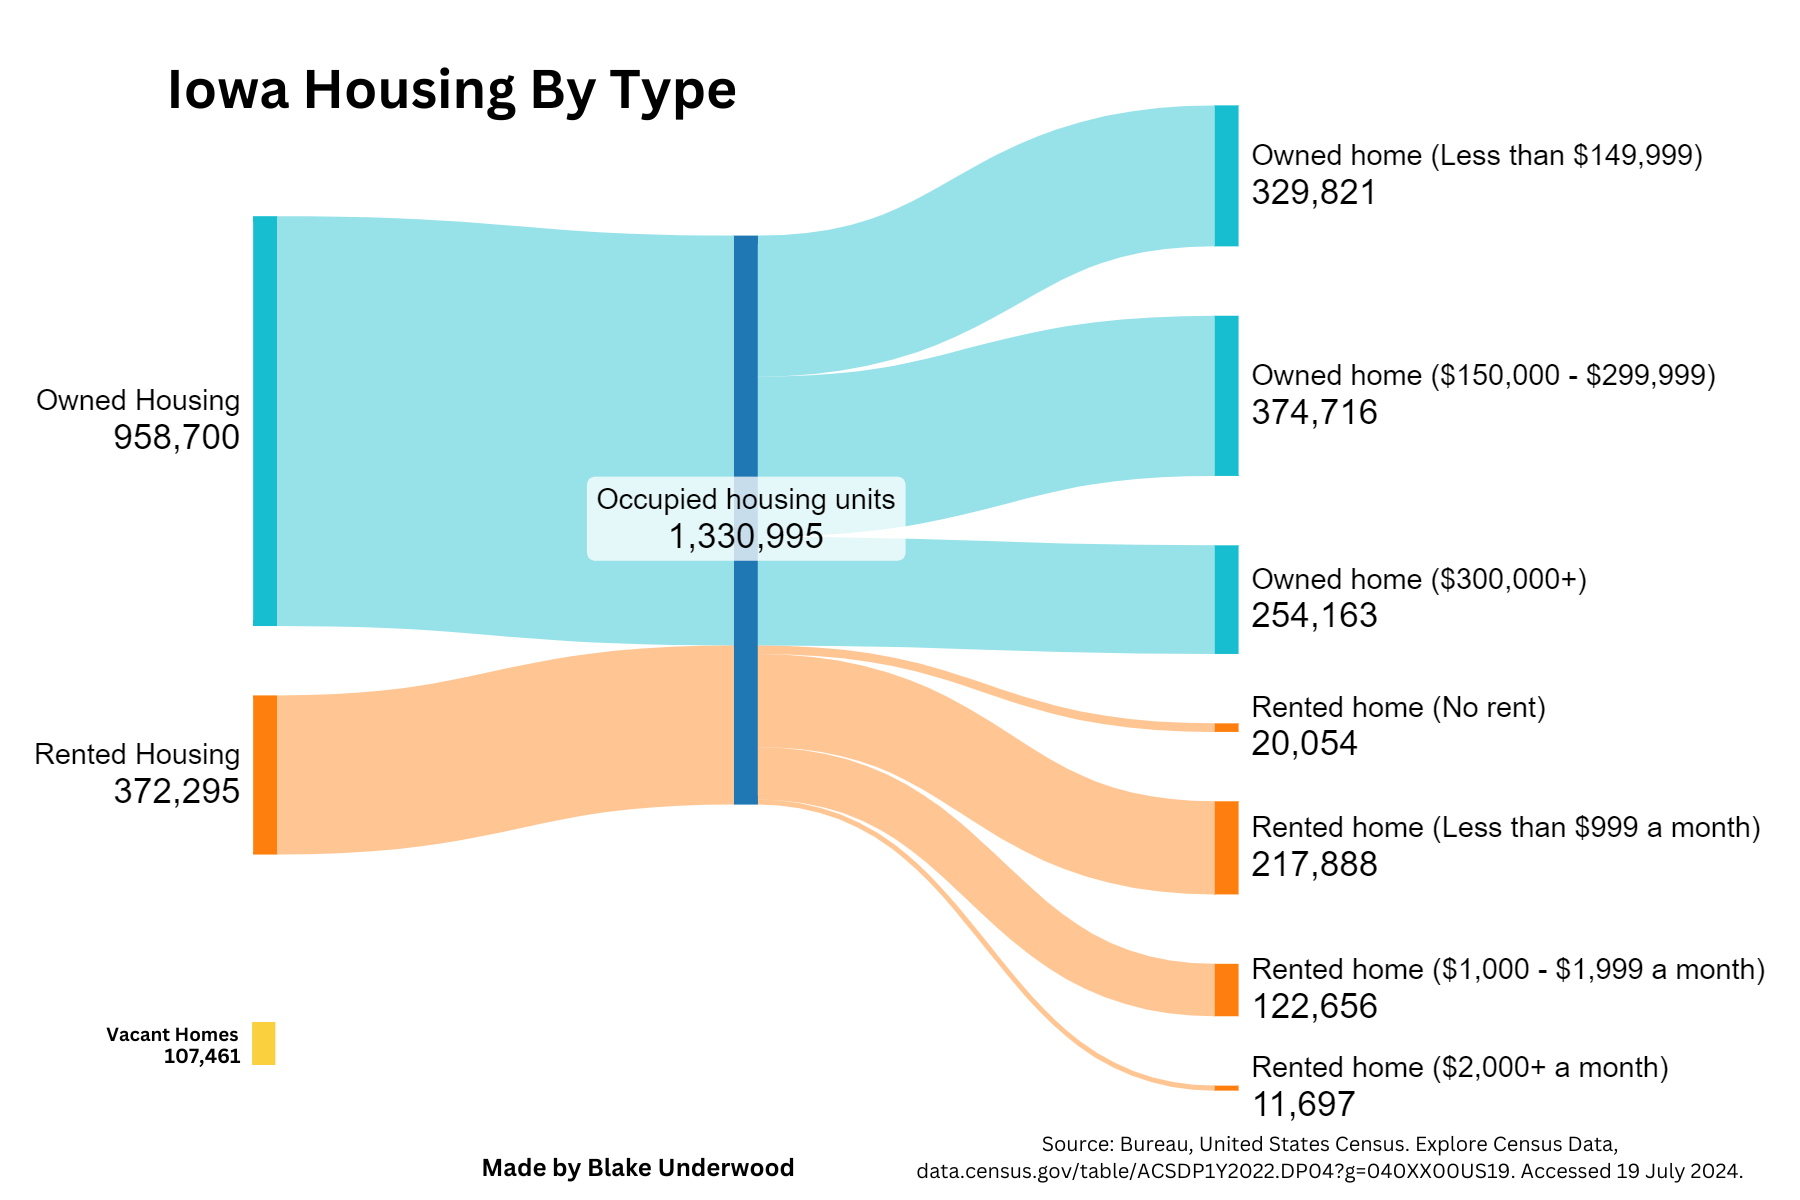
The median home value in Iowa hovers around $220,000, with a corresponding monthly mortgage payment of approximately $1,500. For renters, the median monthly gross rent is about $1,000. Although this may not seem high on a national level for Iowans the cost of owning and renting a home has increased significantly from just a couple years ago.
Homeownership Insight
Between 2000 and 2018, homeownership declined, likely due to the relative affordability of renting compared to home buying. However, a shift occurred around 2018, with homeownership rates beginning to climb. This change is potentially linked to a reversal in affordability trends, as renting became increasingly expensive relative to homeownership.
Housing and Renting Prices
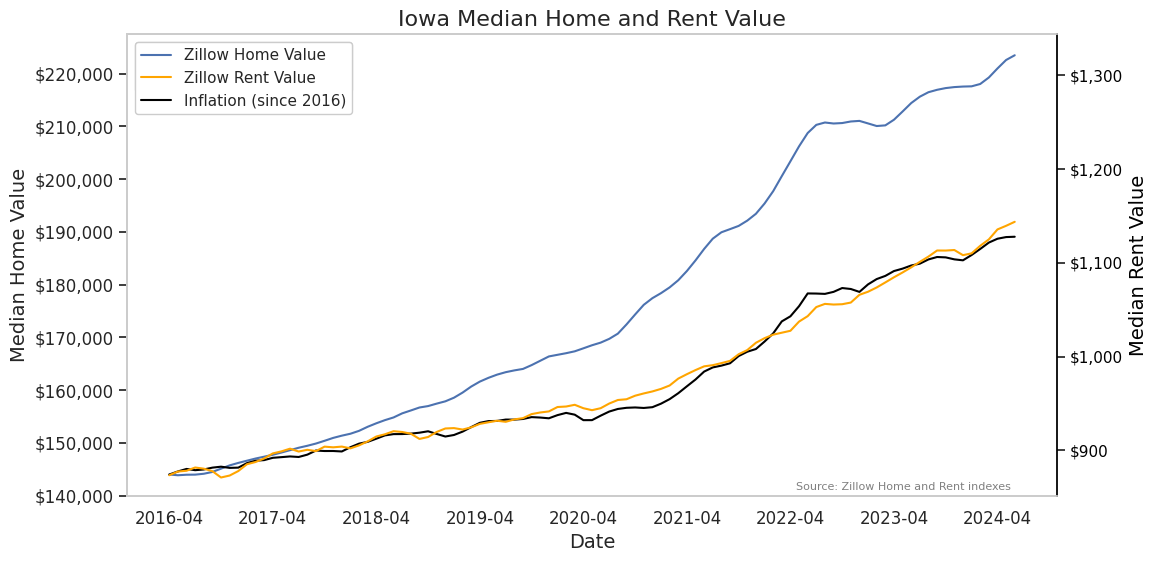
Home values in Iowa have surged in recent years. Between April 2016 and April 2024, home prices increased by a substantial 55.21%. While overall inflation during the same period was 31.05%, a significant portion of this inflation can be attributed to rising housing costs. In fact, it’s estimated that one-third of U.S. inflation is directly linked to changes in home prices. This suggests that the growth in Iowa home values has outpaced the broader inflationary trend
The median rent in Iowa currently sits at $1,175, reflecting a significant 6.8% increase compared to the previous year (Rent.com, 2024). Iowa ranks eighth in the nation for the largest increase in median gross rent in the last year (Rent.com, 2024).
Housing Vs. Renting Insight
The cost to buy a home has been increasing a faster rate then the cost to rent in the last 8 years.
Are Incomes Increasing Enough?
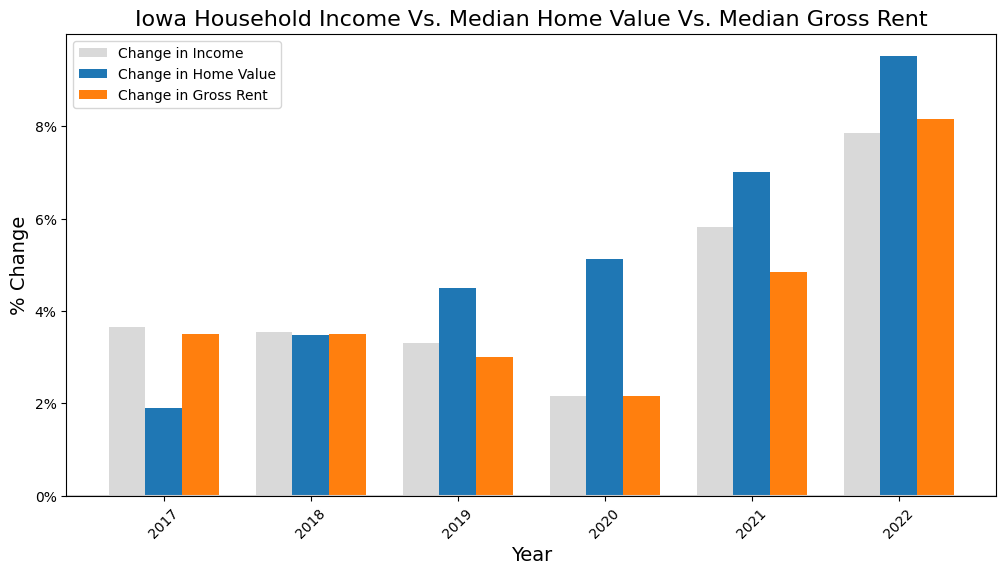
The average Iowan is noticing house prices rising faster than incomes. Housing affordability has changed in Iowa. This is more evidence that housing is becoming less affordable for Iowans. Home value increased more income from 2019-2022. Low interest rates certainly are a good explanation for this. Demand changes due to population changes may be another good reason for this, both of which we will touch on in later sections.
The rental market presents a contrasting narrative to homeownership. While housing prices surged during the pandemic, rental costs remained relatively stable. However, recent data indicates a shift in this trend. Rents in Iowa have experienced rapid growth in 2023 and 2024, coinciding with the Federal Reserve’s interest rate hikes. This accelerated rental cost increase warrants further investigation to understand its implications for Iowa residents.
Income Insight
The cost to buy a home has far exceeded incomes while incomes have kept up with the cost of renting.
Consider Interest Rates
Generally, the housing market slows down when interest rates are higher or increasing. When interest rates rise, the cost of owning a home becomes more expensive due to the higher interest payments, which reduces demand. This reduction in demand then results in a drop in home prices. Conversely, when interest rates are lowered, housing demand increases, causing prices to rise.
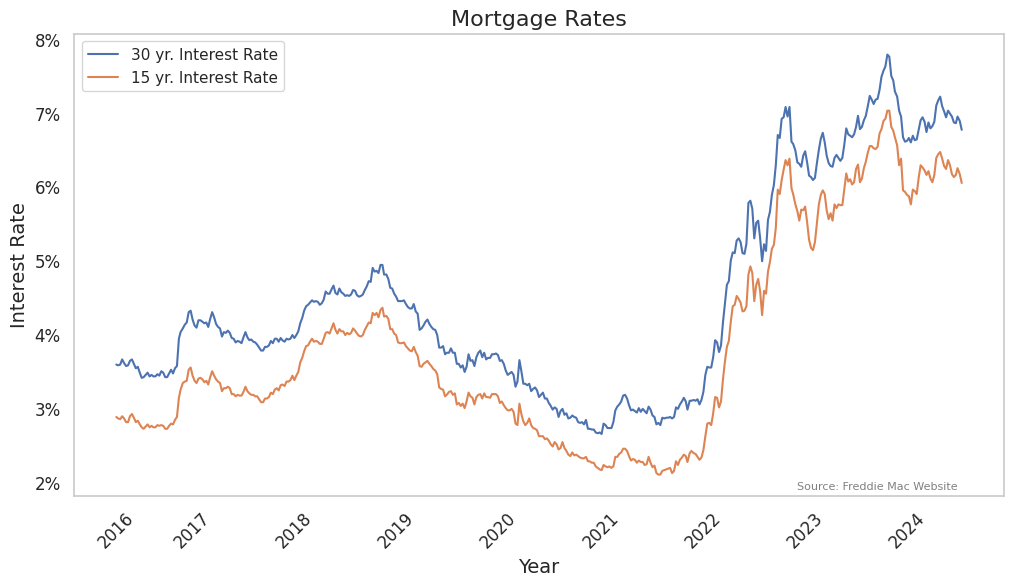
From 2016 to 2022, mortgage interest rates were on a downward trend, making homeownership more affordable and stimulating the housing market. However, starting in 2022, there was a sharp spike in interest rates for 30-year mortgage loans, jumping from around 3% to 7%. This could help explain why rent costs were still pretty affordable through 2022, and would explain why they would of increased once it become to expensive to own a home from increased interest rates.
You might wonder why, despite this increase in interest rates, home values continued to rise during the same period. This scenario is especially concerning for Iowa’s first-time homebuyers. They faced the double burden of elevated home prices and higher interest rates compared to just two years prior, in 2024. This situation makes entering the housing market significantly more challenging and expensive, potentially delaying or even preventing many from achieving homeownership.
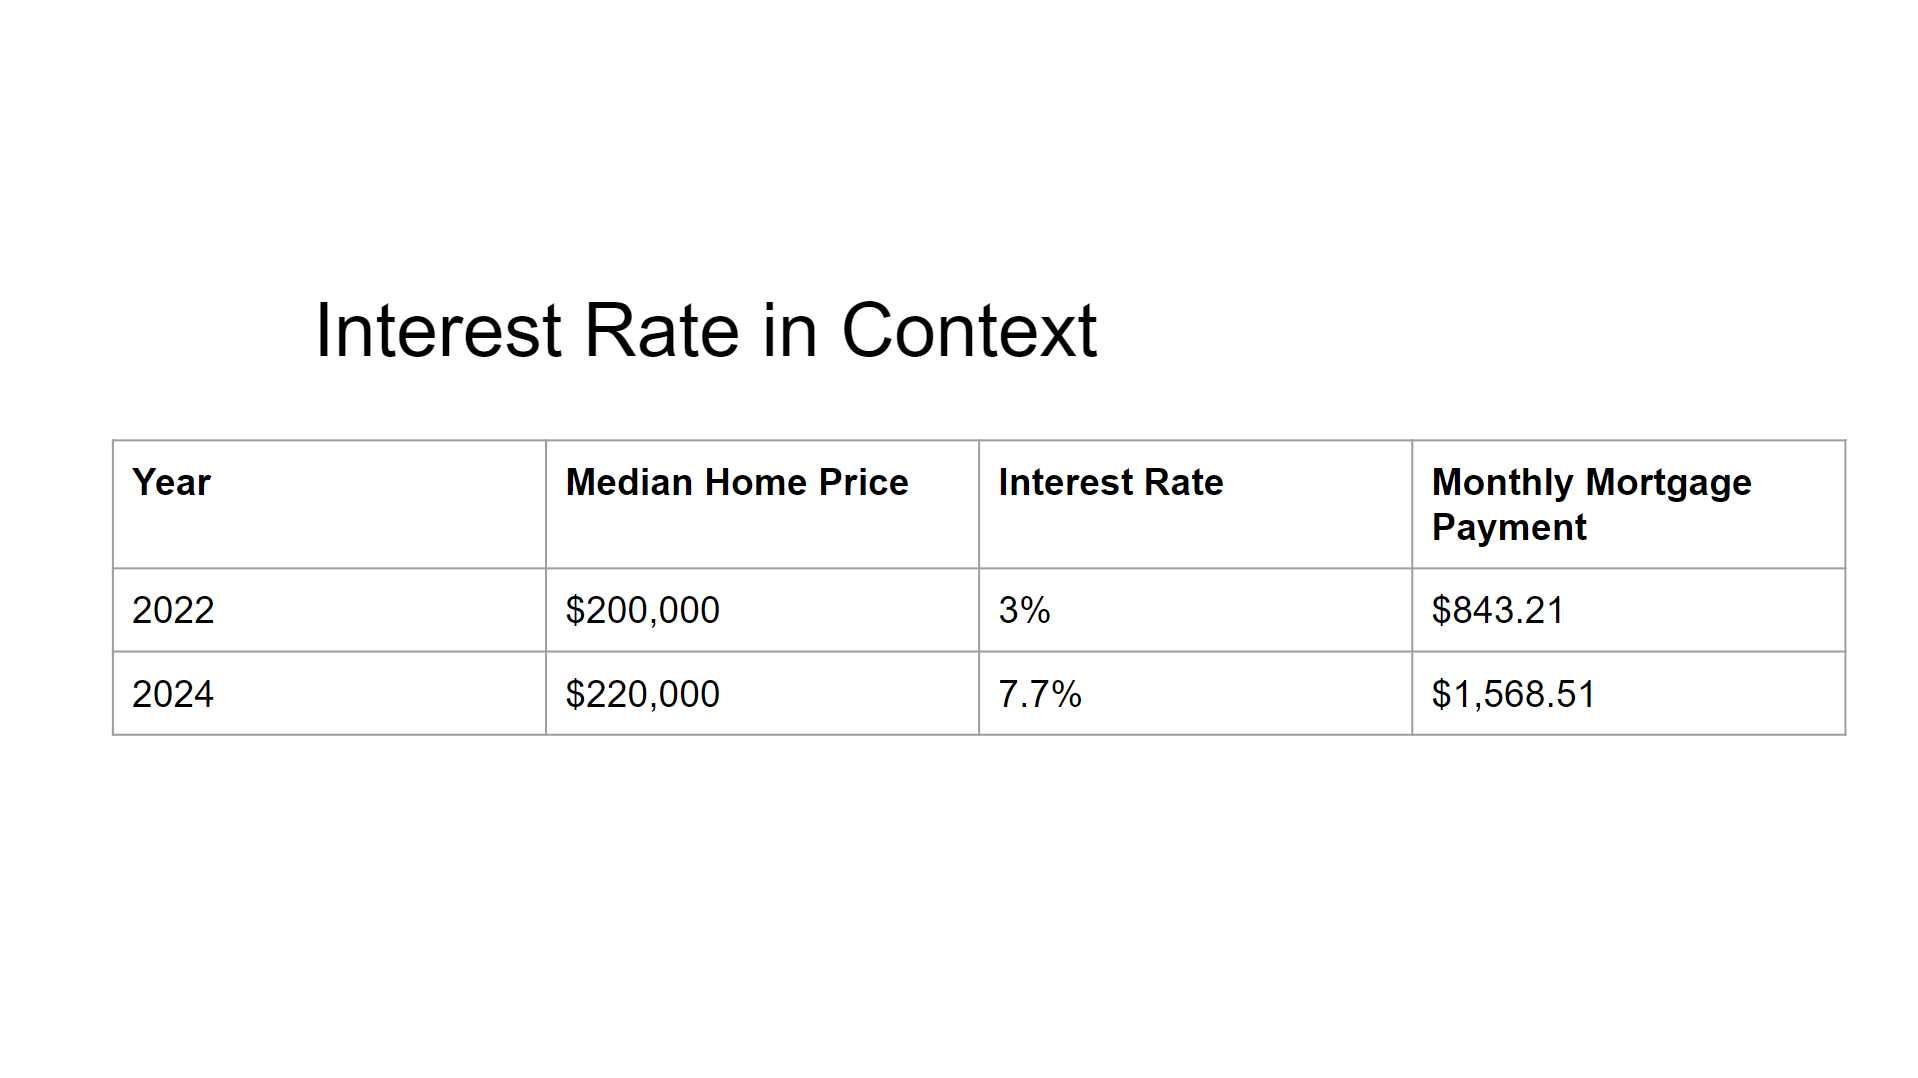
Mortgage Costs in Context
The median home listed on Zillow in 2022 was sold for around $200,000. If you were to buy a typical house in early 2022, the interest rates for a 30-year loans would be around 3% assuming you have normal credit you would have a monthly mortgage cost of $843.21(bankrate loan calculator). Had you instead waited 2 more years to get that same house in late 2023 or early 2024 that same home would cost $220,000 and the interest rate would of risen to 7.7% meaning that your monthly costs would be $1,568.51 per month for the same house.
Why Housing Prices Rise
The FED plans on lower interest rates over the next year making homes more affordable on that front but what about house prices? I have identified 4 reasons that I believe increase house prices I want to investigate that help explain why house prices increase:
- Construction is not keeping up with demand for homes.
- The housing Dilemma.
- Investors are speculating on the market.
- People are taking on greater debt to get homes.
Reason one
Construction hasn’t kept up with the number of people who need a home.
Rising costs to build a home is often the most common reason people give for rising house prices. Basic supply and demand tell us that if more people are looking to buy homes and fewer people are looking to sell, then prices will rise. A potential way to get an idea of housing supply is to examine the number of housing units, but it is a little bit more complicated to get housing demand, but I’m going to analyze change in population. We know that if population is increase we can expect more demand for houses. So viewing the change in housing units compared to the change in population is a logical place to start. However it’s important to note that more housing then people per household size may be built, but this doesn’t mean that construction is keeping up with demand.
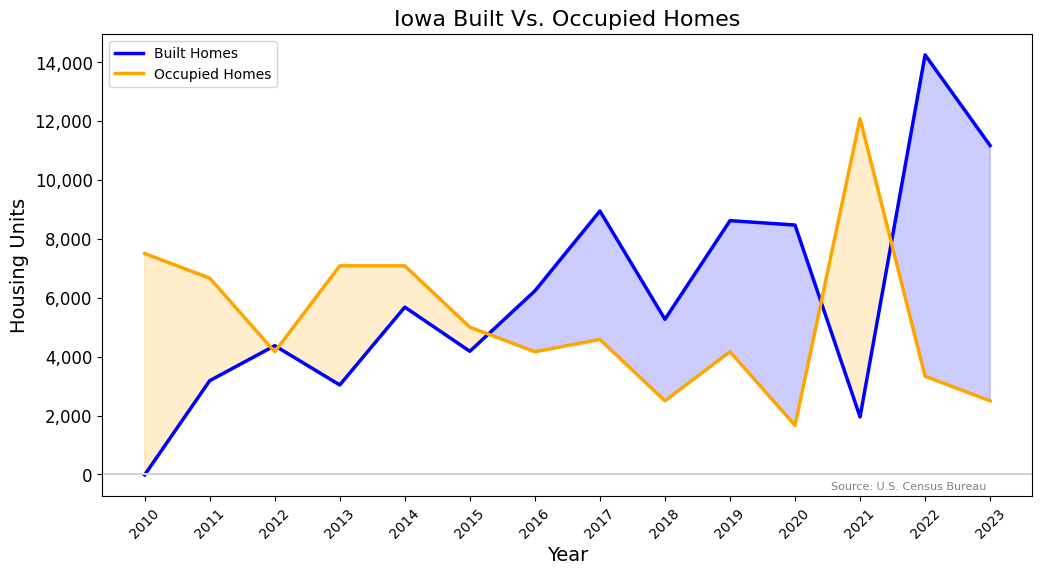
Change in household size is calculated by dividing the population change by 2.4 which is the average household size in Iowa.
When we look at how many houses are being built compared to the changing population in Iowa, we see rising housing construction but slowing population growth; you would intuitively think housing prices would decrease because the housing supply would increase faster than demand. However, this graph isn’t saying that. All this graph proves is that new house construction per population level is going down, but this doesn’t mean there isn’t enough housing.
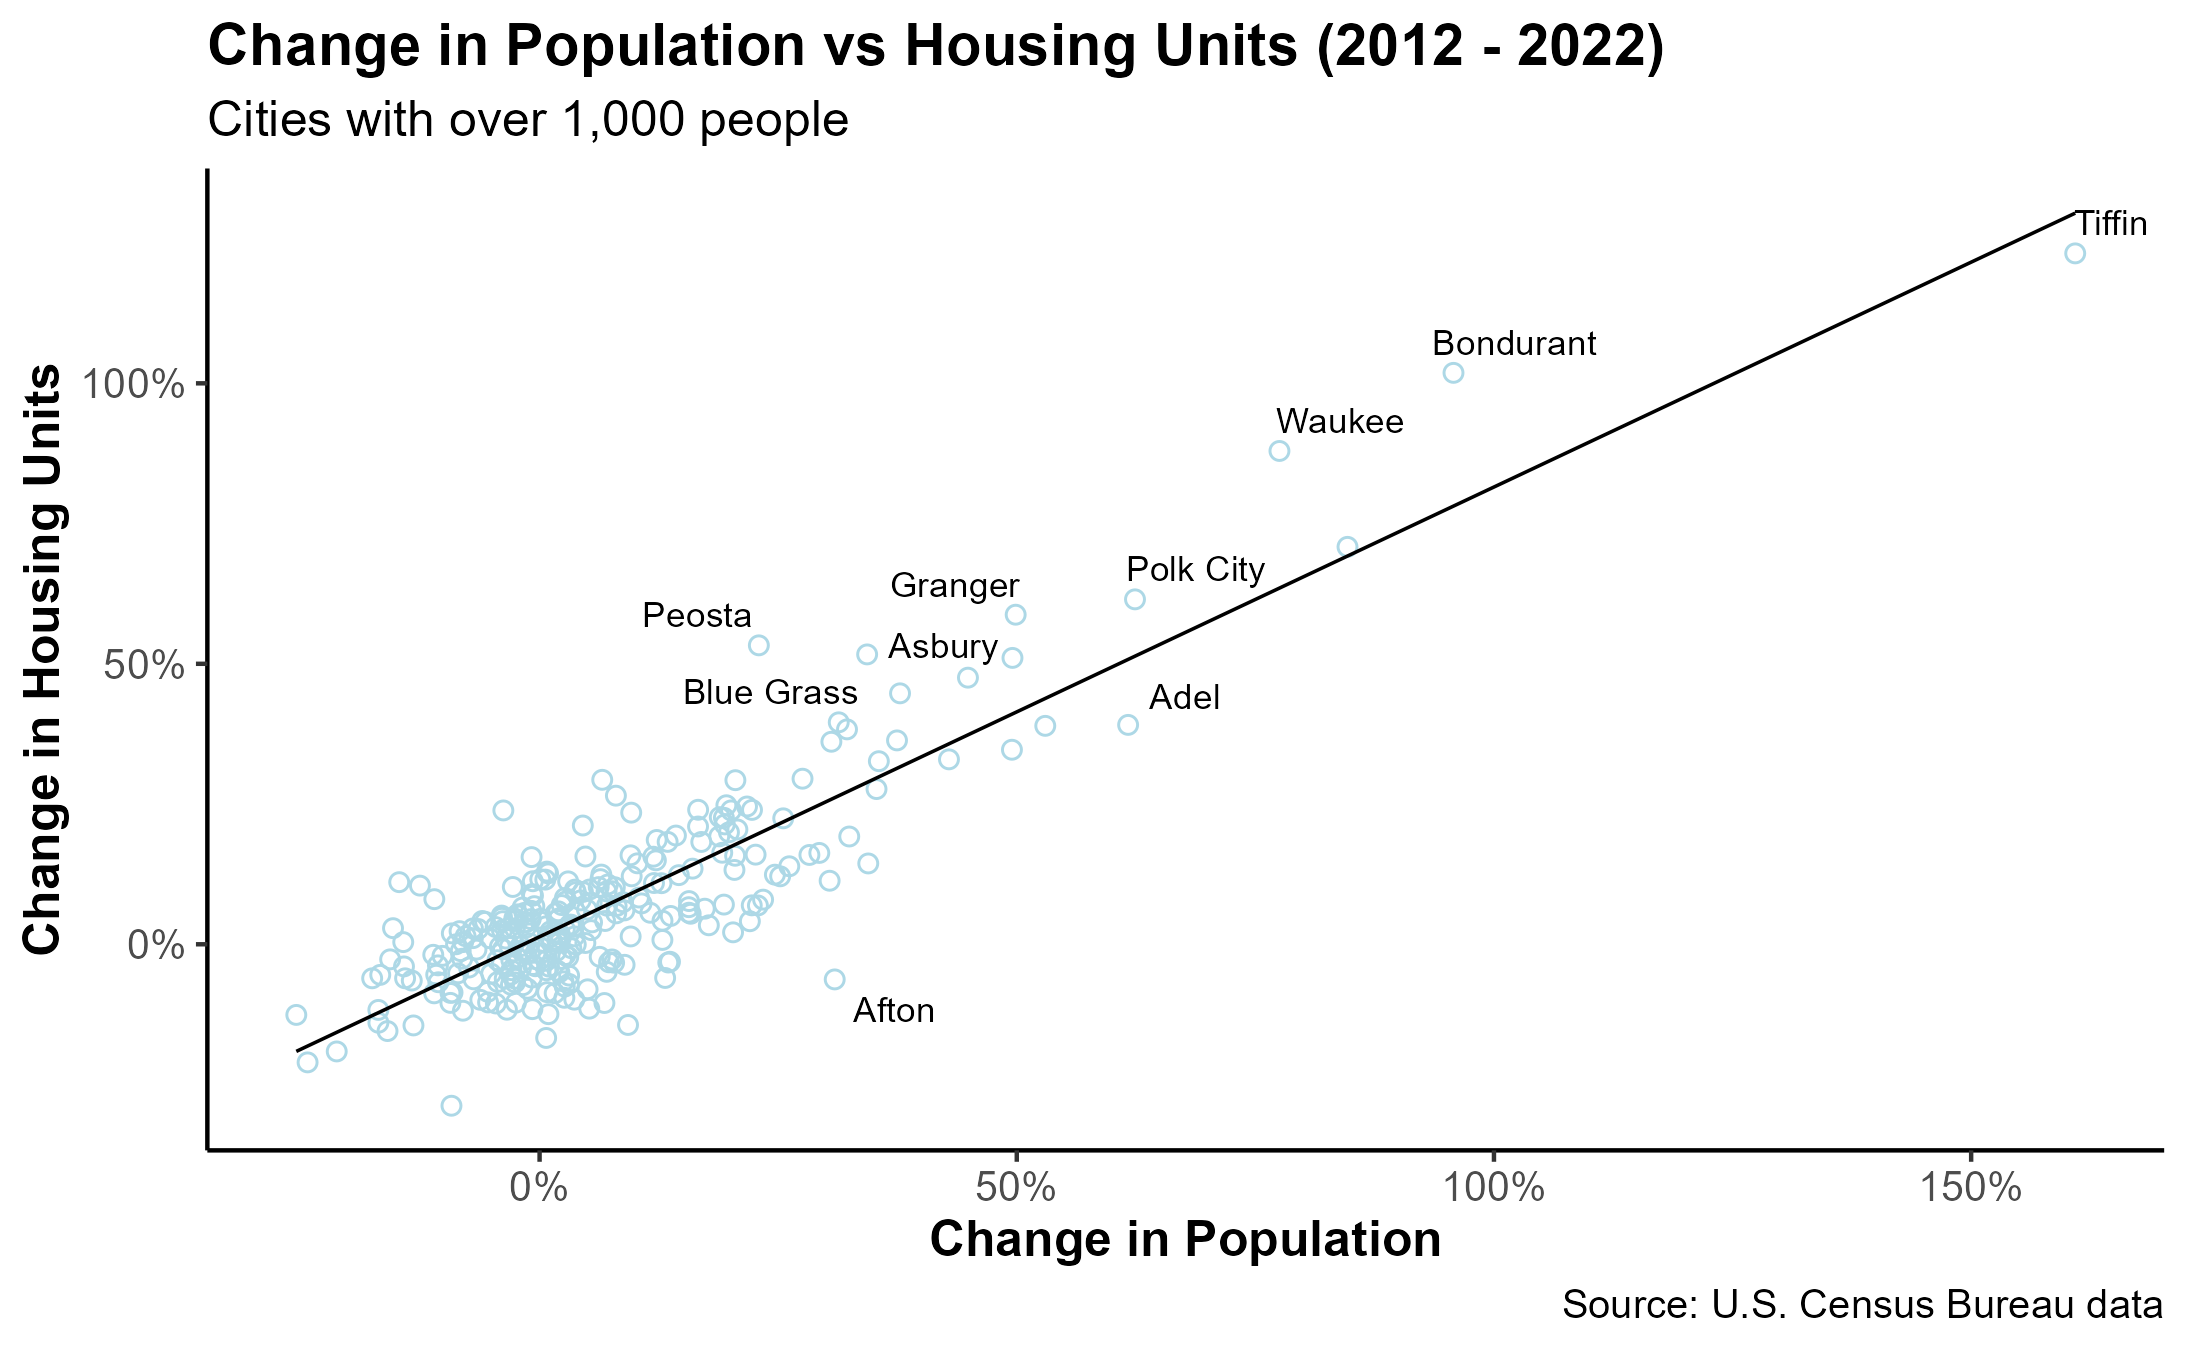
When looking at the cities of Iowa, we see a direct correlation between the change in housing supply and the change in population, and we can see that there does appear to be more cities with a slighter greater change in housing supply than population. So this begs the question why could this be happening? Isn’t this evidence that there isn’t a housing shortage in Iowa?
The population may not be outgrowing the new housing supply but there are still a few problems that could be contributing to a housing shortage. I have identified 3 potential problems that occur when you just analyze the change in housing vs. the change in population:
House deteriorating problem.
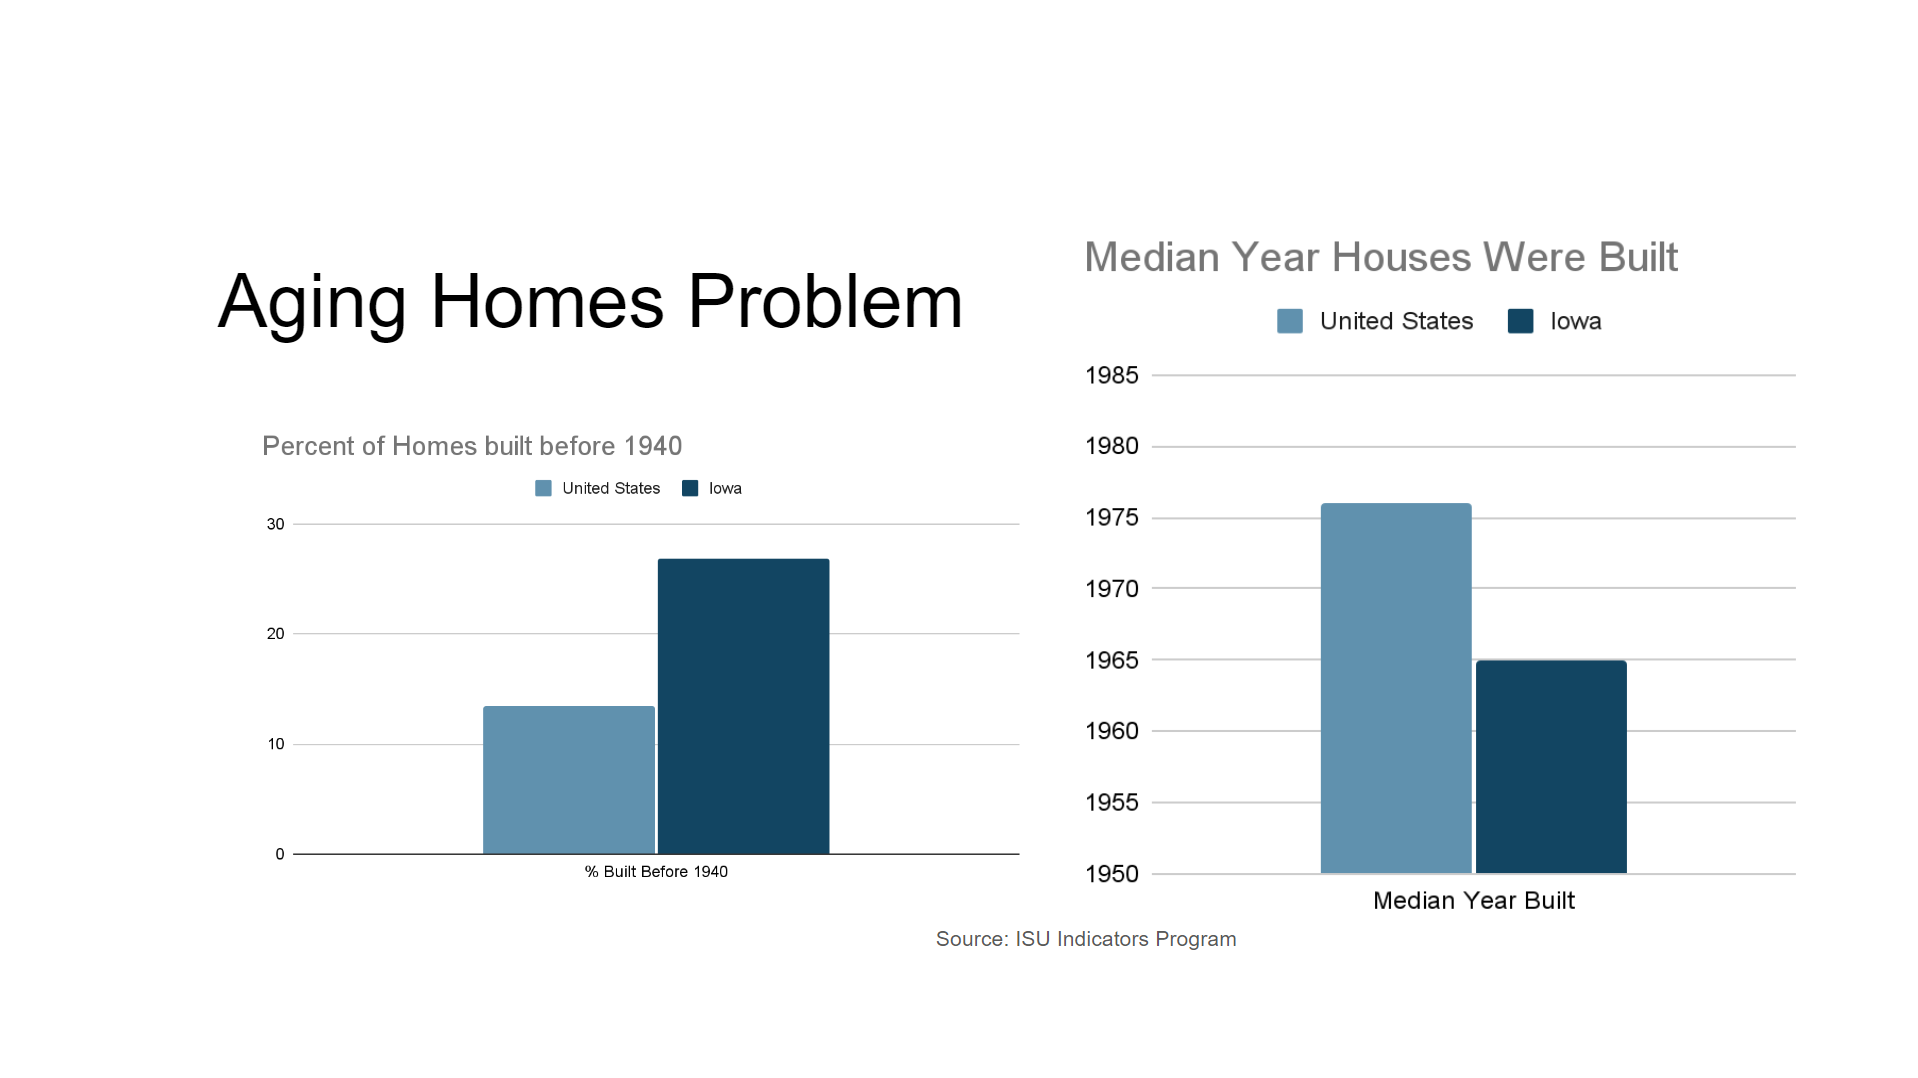
- We don’t know how long houses have lasted in this period. If homes are lasting longer or aren’t that old then we shouldn’t need to build as many home new homes for the growing population. In our case the opposite appears to be true the median year all the houses in Iowa were built in is 1965, with 26.9% being built before 1940(ISU indicators). For many homes there expected life span is going to be around 60 years meaning that many of Iowa’s homes would be ready for replacement and that should be causing greater construction of new homes regardless of population growth. It does seem that home deterioration may be a factor into why change in housing is exceeding change in population in Iowa.
Household size changes problem.
- More homes are actually needed to accommodate for roughly the same amount of people but who want to live with less people. This will result in a greater need for housing regardless of population growth. But this is more of a historical reason for why house prices have risen in the past in Iowa, because household size has actually become quite steady around 2.4 people per household in Iowa with even an increase in household size after the housing crisis of 2008, which household sizes have stayed elevated ever since. We can see that in the last decade household size has been relatively stable.
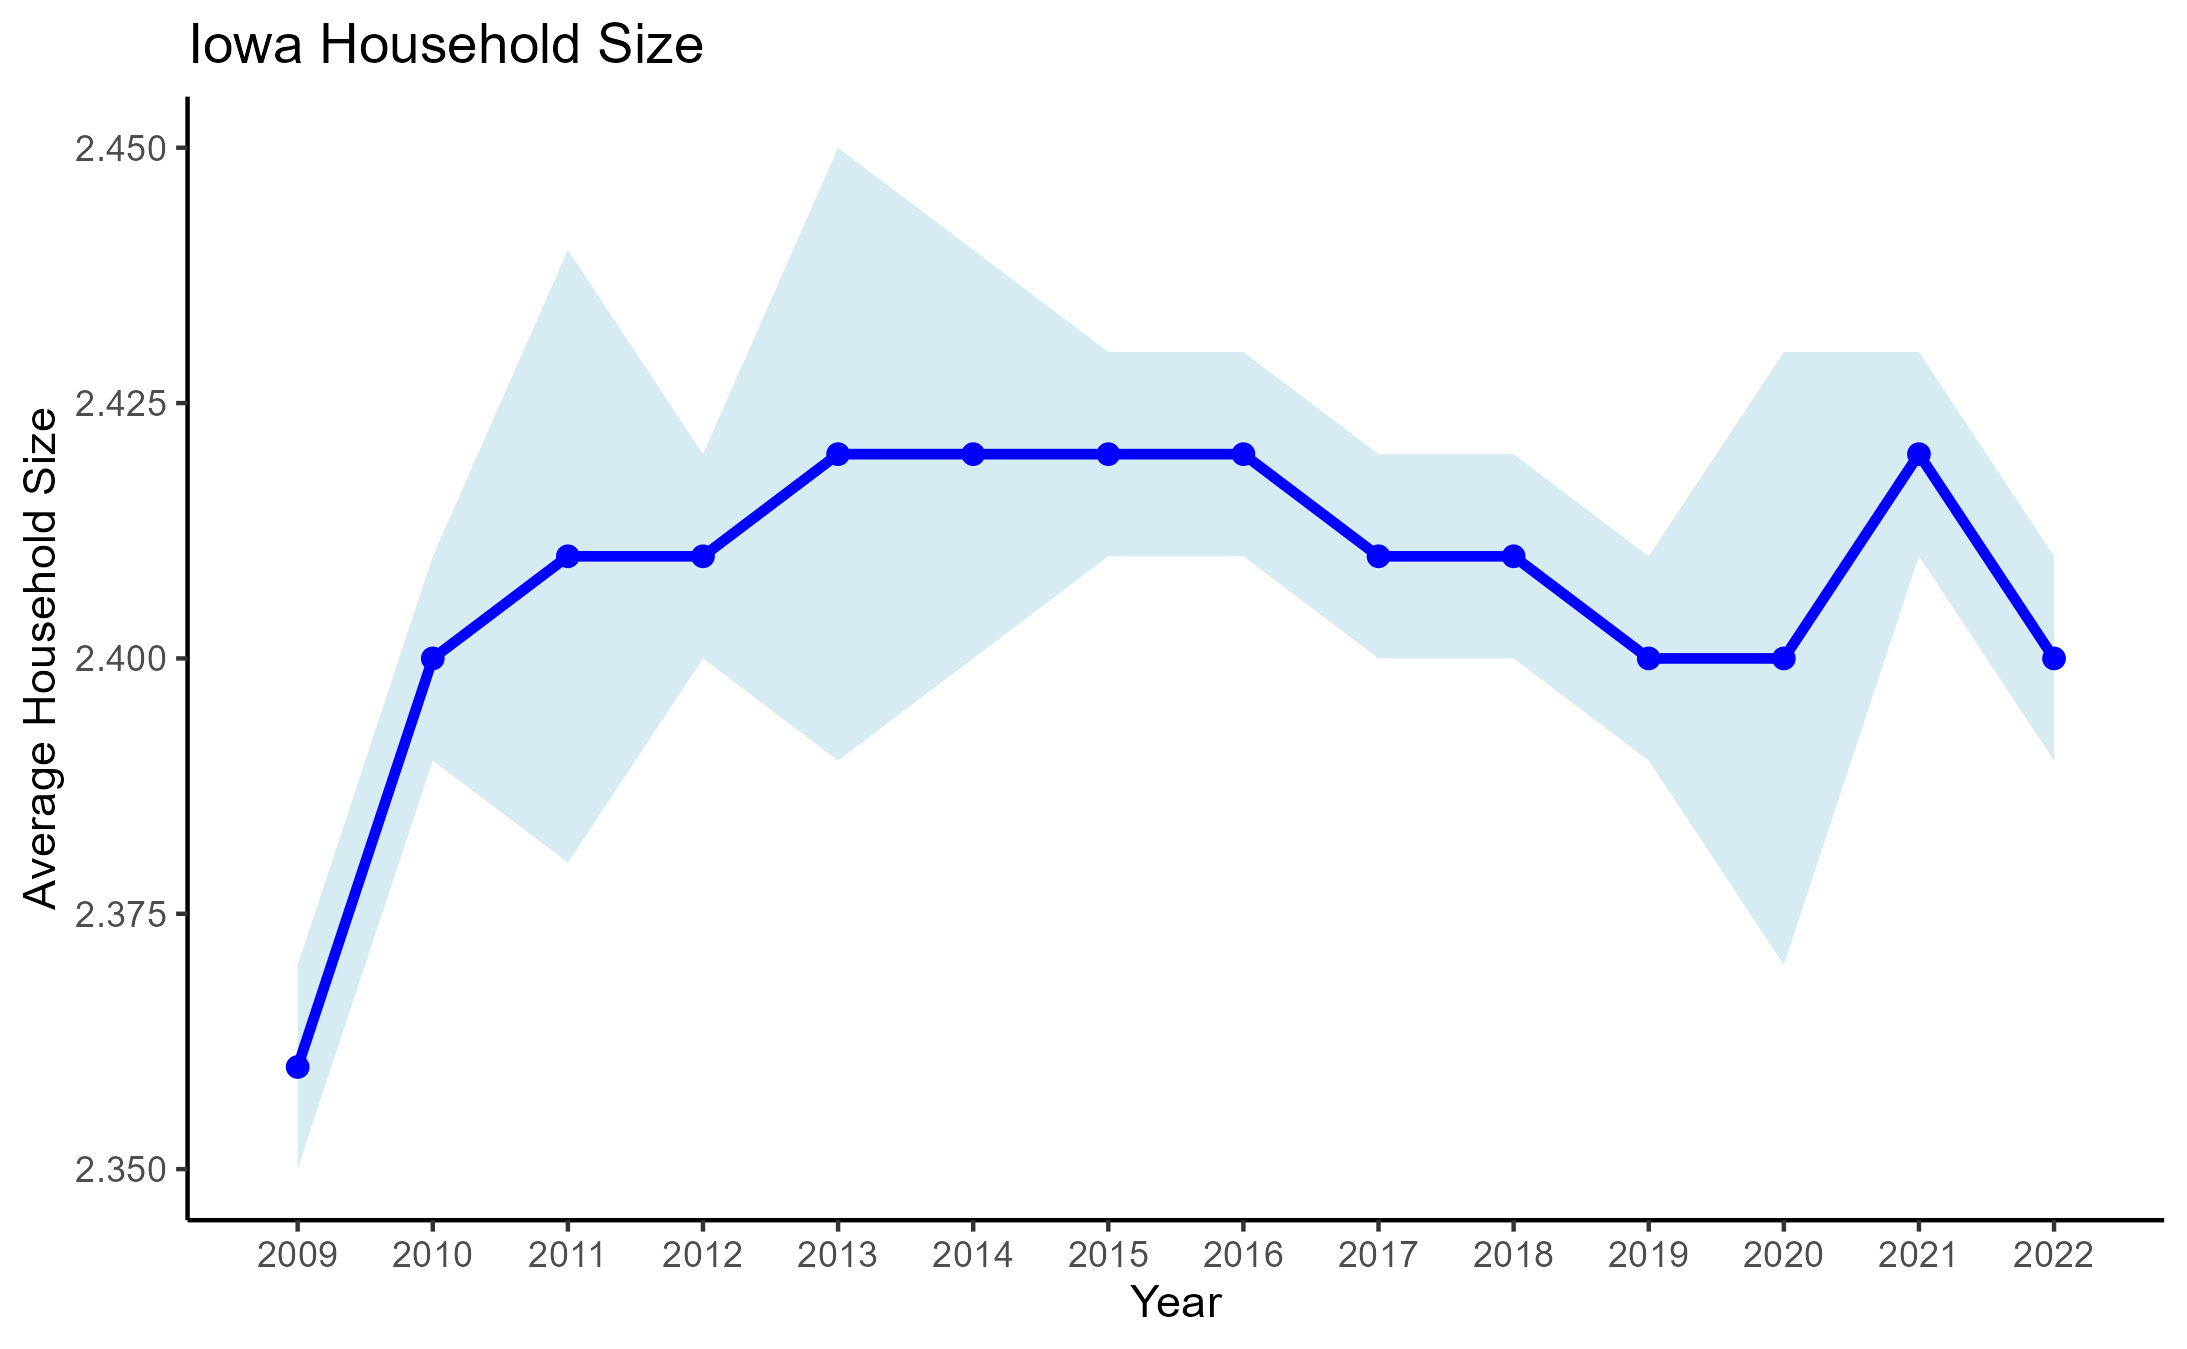
It doesn’t appear that in the last decade household size changes can be attributed to why change in housing development has exceeded change in population in Iowa.
Vacancies are increasing in certain areas problem.
- Given that people are moving from rural Iowa to more urban areas, it may appear that housing supply is sufficient but actually the houses are in the wrong place and therefore being left vacant. This would result in an oversupply of housing in rural areas and an undersupply of housing in urban areas. We can see that house prices are increasing significantly more in urban areas which helps provide some evidence to this occurring. When we look at state-wide vacancy rates, we see they have been trending downward, but before the pandemic was very stable overall. When analyzing the data we see that migration from rural to urban areas in Iowa has actually been slowing down and we don’t have strong evidence to the claim that people in rural areas are leaving more homes vacant driving up urban housing costs.
Conclusion to Construction Reason
So I looked deeper into housing production relative to population changing. We saw that enough housing is being built for the growing population, but we still can’t rule out that we aren’t experiencing a housing shortage because many houses in Iowa may be expiring and in need of reconstruction. However we can rule out that this is occurring due to housing vacancies or changes in household size.
Reason Two
The Housing Dilemma
The development of affordable housing often presents a classic “tragedy of the commons” scenario. While constructing more apartments can alleviate housing shortages and potentially lower overall costs, it frequently faces opposition from existing homeowners. This resistance stems from concerns about property values, increased traffic, and potential changes to neighborhood character.
When the individual interests of homeowners trumps the broader community interest in affordable housing this can contributing to rising house costs.
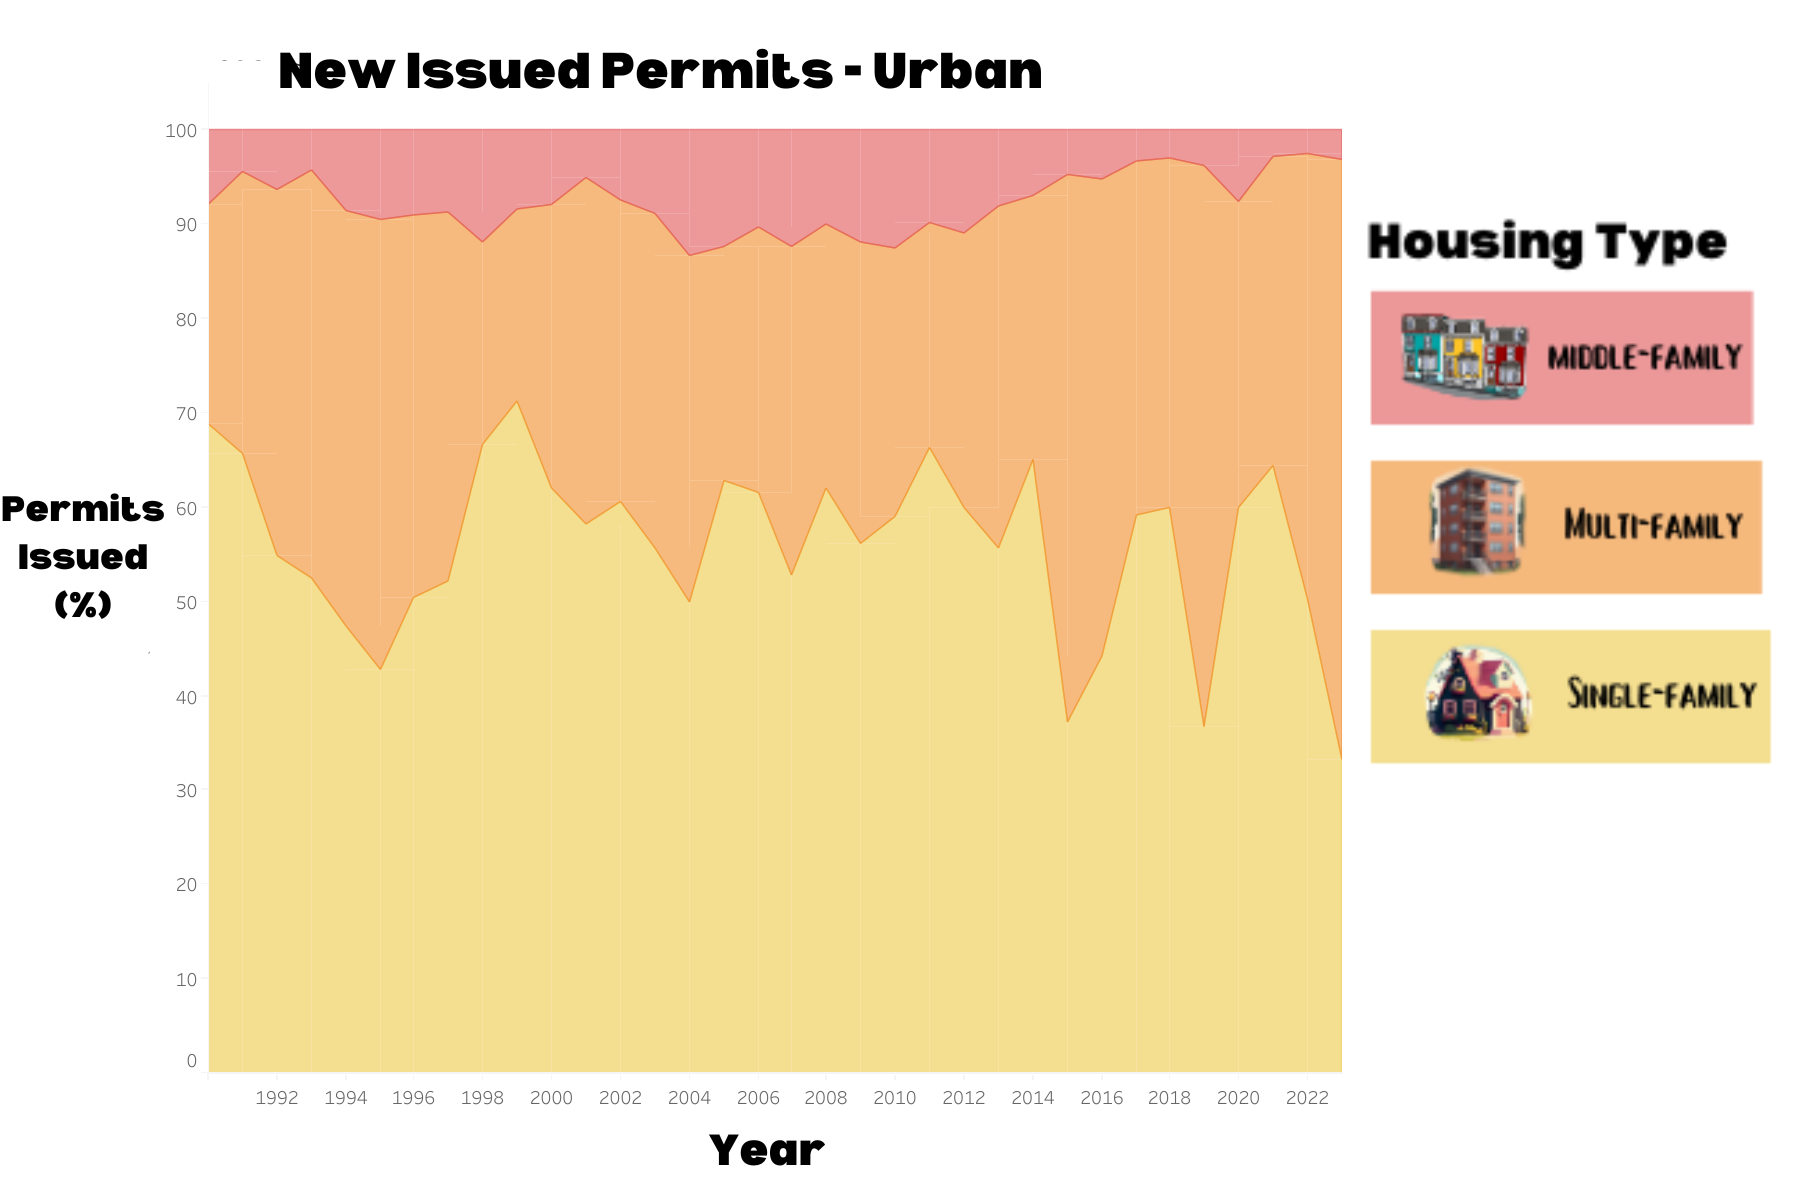
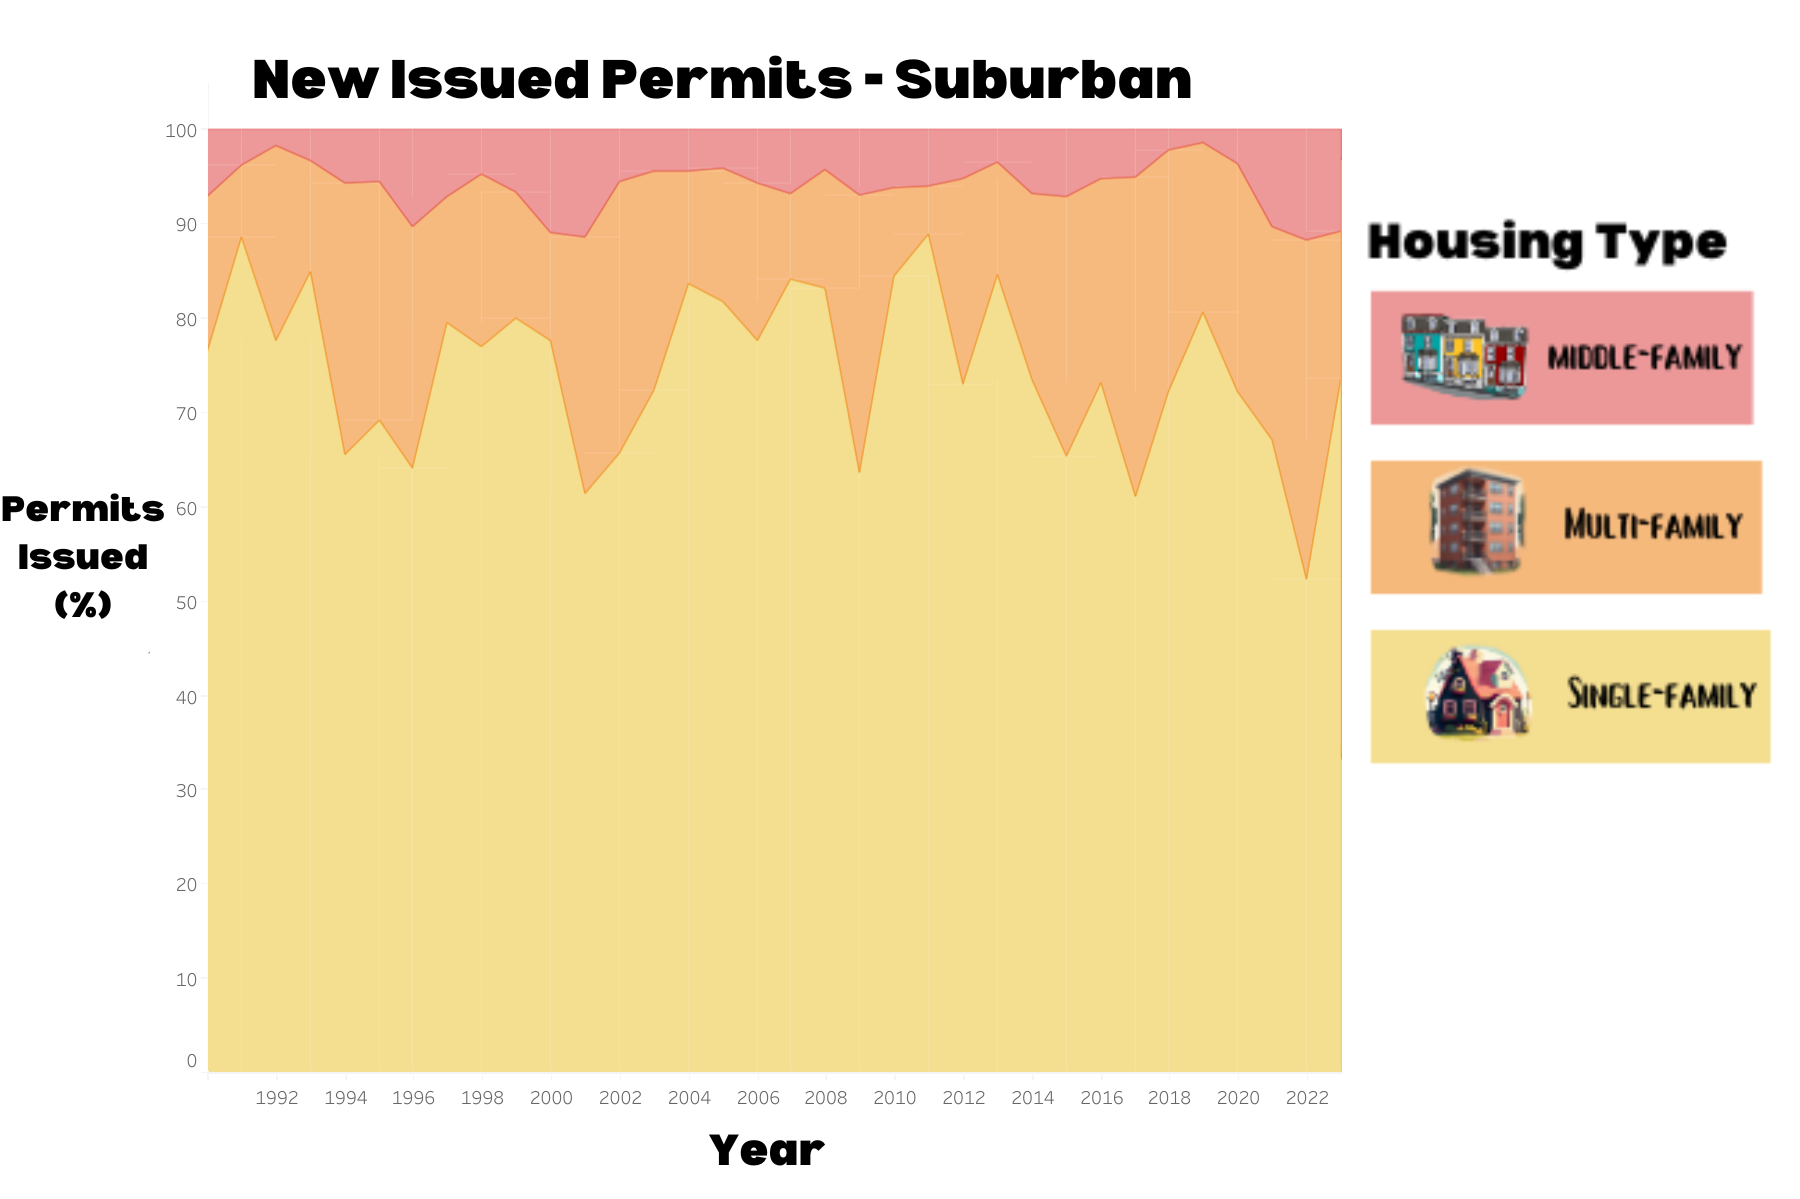
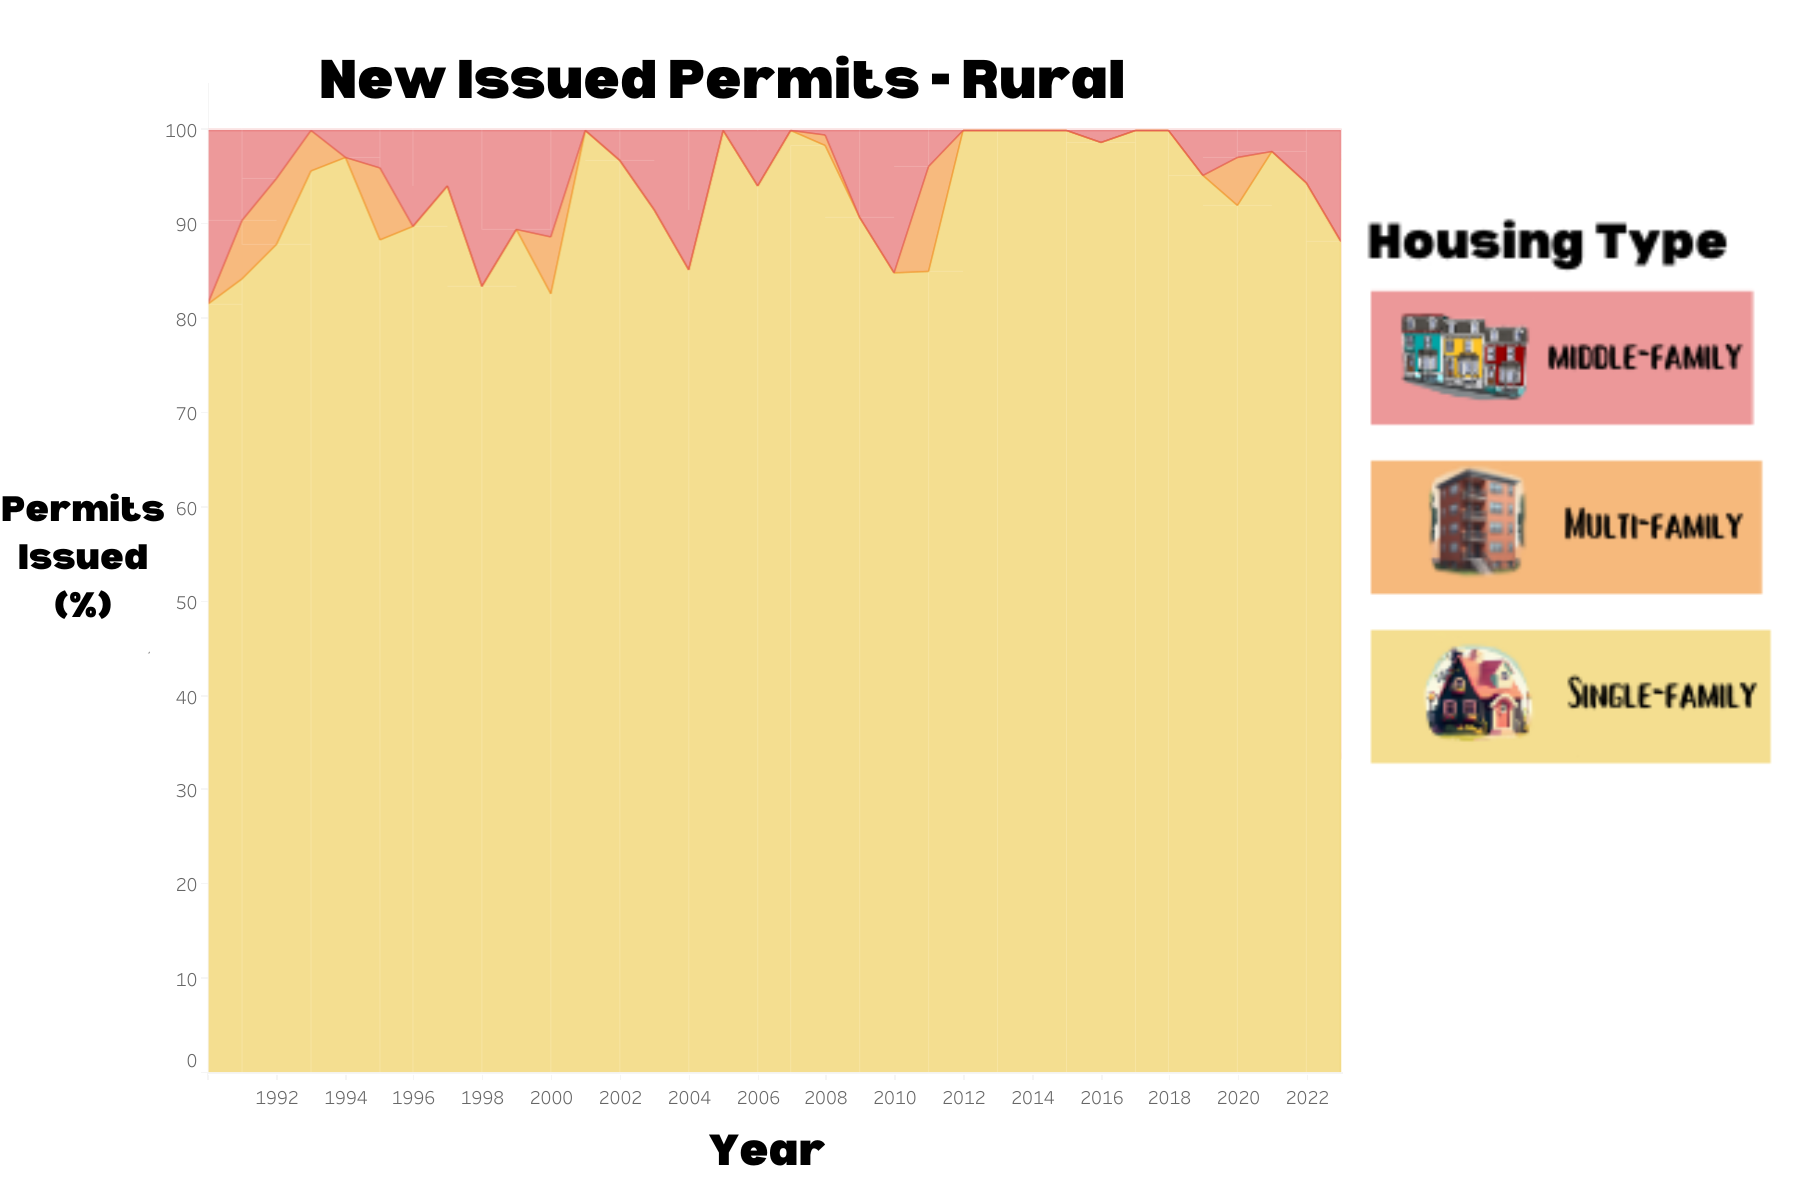
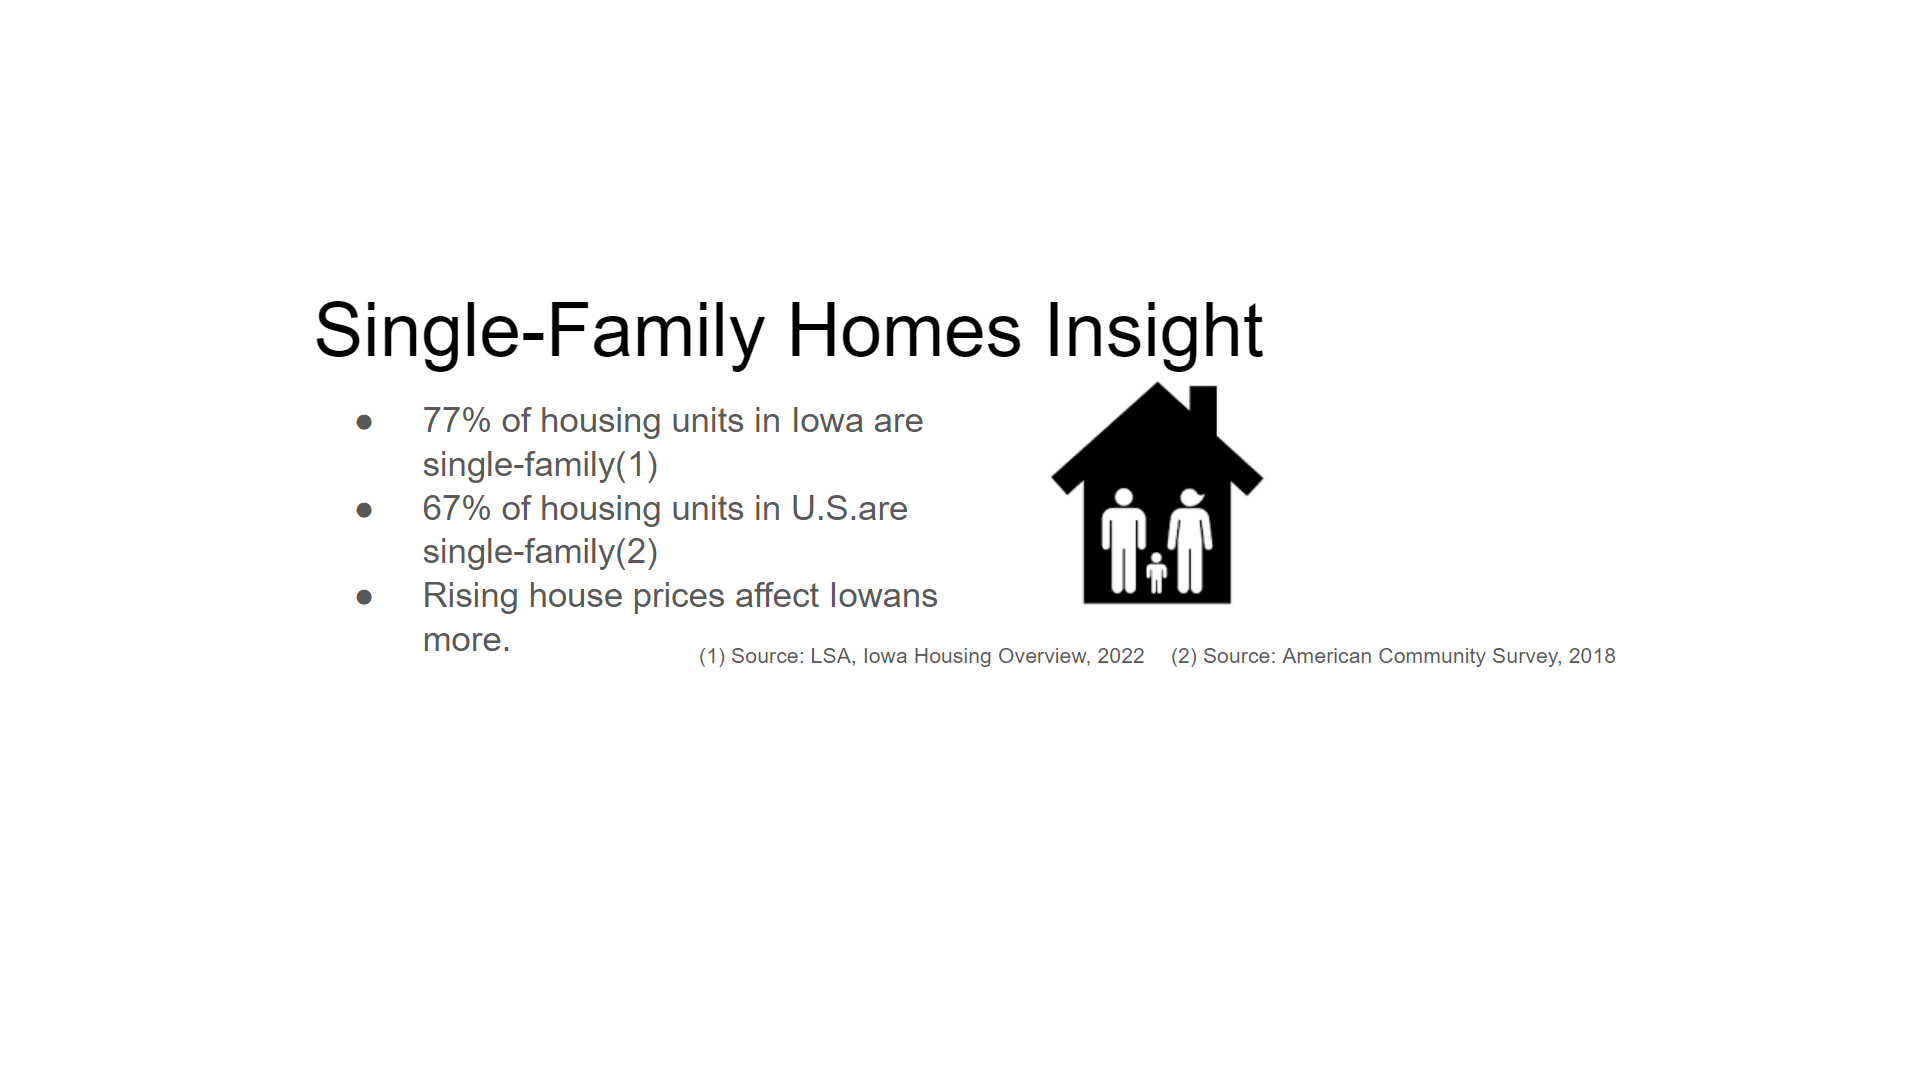
We can see that Iowa’s more populated urban area’s are more willing to allow for multi-family in order to lower housing costs than Iowa’s suburban and rural area’s. Because Iowa is significantly more rural and suburban than urban, we should expect Iowa to be more effected by increases in single-family houses then by multi-family housing.
Reason Three
Excessive Speculation
If houses were purely consumption goods like cars, food, etc., then explaining house prices purely based on supply and demand would be sufficient because the only economic factors affecting house prices would be the number of people who want a house and the number of houses available, unfortunately sometimes people treat housing as an investment and buy up houses expecting the prices to rise, when many people start doing this is drive up housing prices and causes a housing bubble.
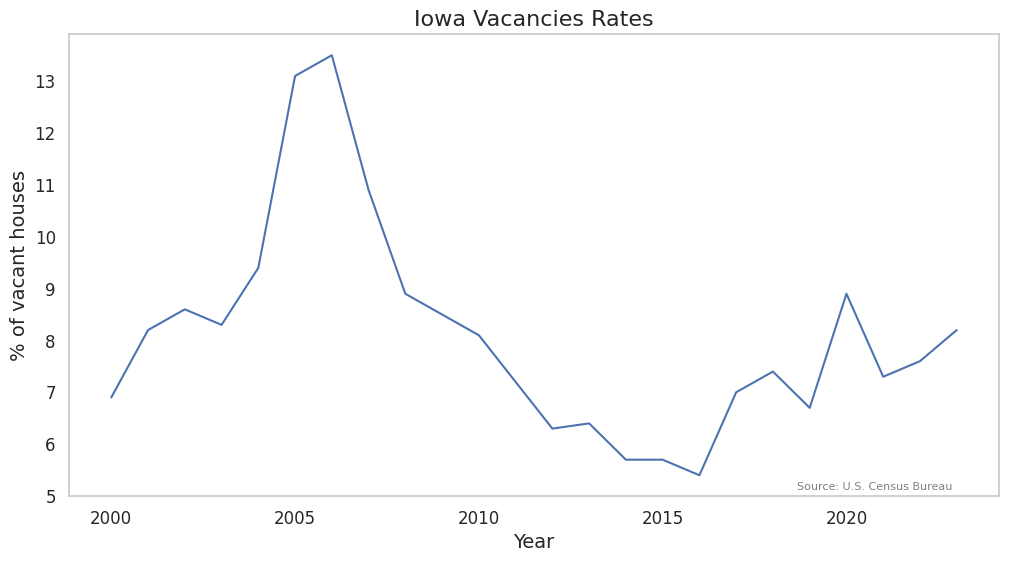
One quick way to get an idea about whether we are experiencing a housing bubble is to look at housing vacancies. We should assume that vacancies should be decreasing as housing costs go up. But This doesn’t always happen though during the 2009 bubble massive house speculation increased housing prices despite the fact that more properties were left empty, vacancy rates in the U.S. peaked at 11.1% in 2009 and has been trending down since.
If you recall from my previous vacancy rate graph housing vacancies are trending down since 2006 in Iowa but have been on the rise since 2016 but it’s way below any alarming levels at this point.

Reason Four
Financialization of Housing
lower interest rates, can be a double-edged sword for housing prices. While it allows more people to enter the market. Buyers with lower interest rates can afford larger mortgages, pushing up housing prices to reflect the increased buying power. This can create a situation where cheaper debt isn’t necessarily translating to greater affordability.
Summarizing Iowa’s Housing Affordability
To get a general sense of Iowa’s housing market we looked at 4 pillars of housing:
- Home ownership rates.
- Housing and rental prices.
- Relative income levels.
- Mortgage interest rate.
After looking at these 4 metrics for analyzing housing we realized that Iowans were buying less homes, housing and renting prices were skyrocketing, income kept up with rents for awhile and hasn’t kept up at all with housing prices, interest rates have been elevated the last 2 years in an attempt to cool down the market, and many other insights.
But these insights weren’t telling the entire story because we didn’t have a strong case for why house prices were increasing so much even despite hikes in interest rates. So we looked at four reasons why housing prices may be rising:
- Construction is not keeping up with demand for homes.
- The housing Dilemma.
- Investors are speculating on the market.
- People are taking on greater debt to get homes.
After looking at these reasons we found that construction may be keeping up with demand and can’t be blamed for the housing shortage, we may be under producing multi-family housing in Iowa, which makes Iowa effected more by rises in single-family housing cost changes, there isn’t great evidence that we are experiencing a housing bubble even though vacancies have been rising since 2016 in Iowa, and Iowans didn’t take on to much debt to buy there homes.
Comparing Classifications of Cities
We have classified the cities into five groups, core cities of a Metropolitan Statistical Area, also known as MSA, (eg. Des Moines), metropolitan cities with above-average growth for their MSA (eg. Ankeny), metropolitan cities with below-average growth for their MSA (eg. Nevada), micropolitan cities (eg. Marshalltown), and rural places (eg. Decorah). Note that rural does not necessarily mean agricultural. A rural place is any place that did not meet the requirements for any of the other categories. It is any town with less than 10,000 people that is located outside of a metropolitan county. Ultimately, our goal is to understand the economic impacts of zoning on the housing market for different types of cities. Before this, we must first understand their housing markets. In the coming section, we seek to understand how much the median resident earns, how much they spend on housing, what percentage of residents in each city classification are cost-burdened by housing, and what income a resident would need to make to be below the cost-burden line for rent.
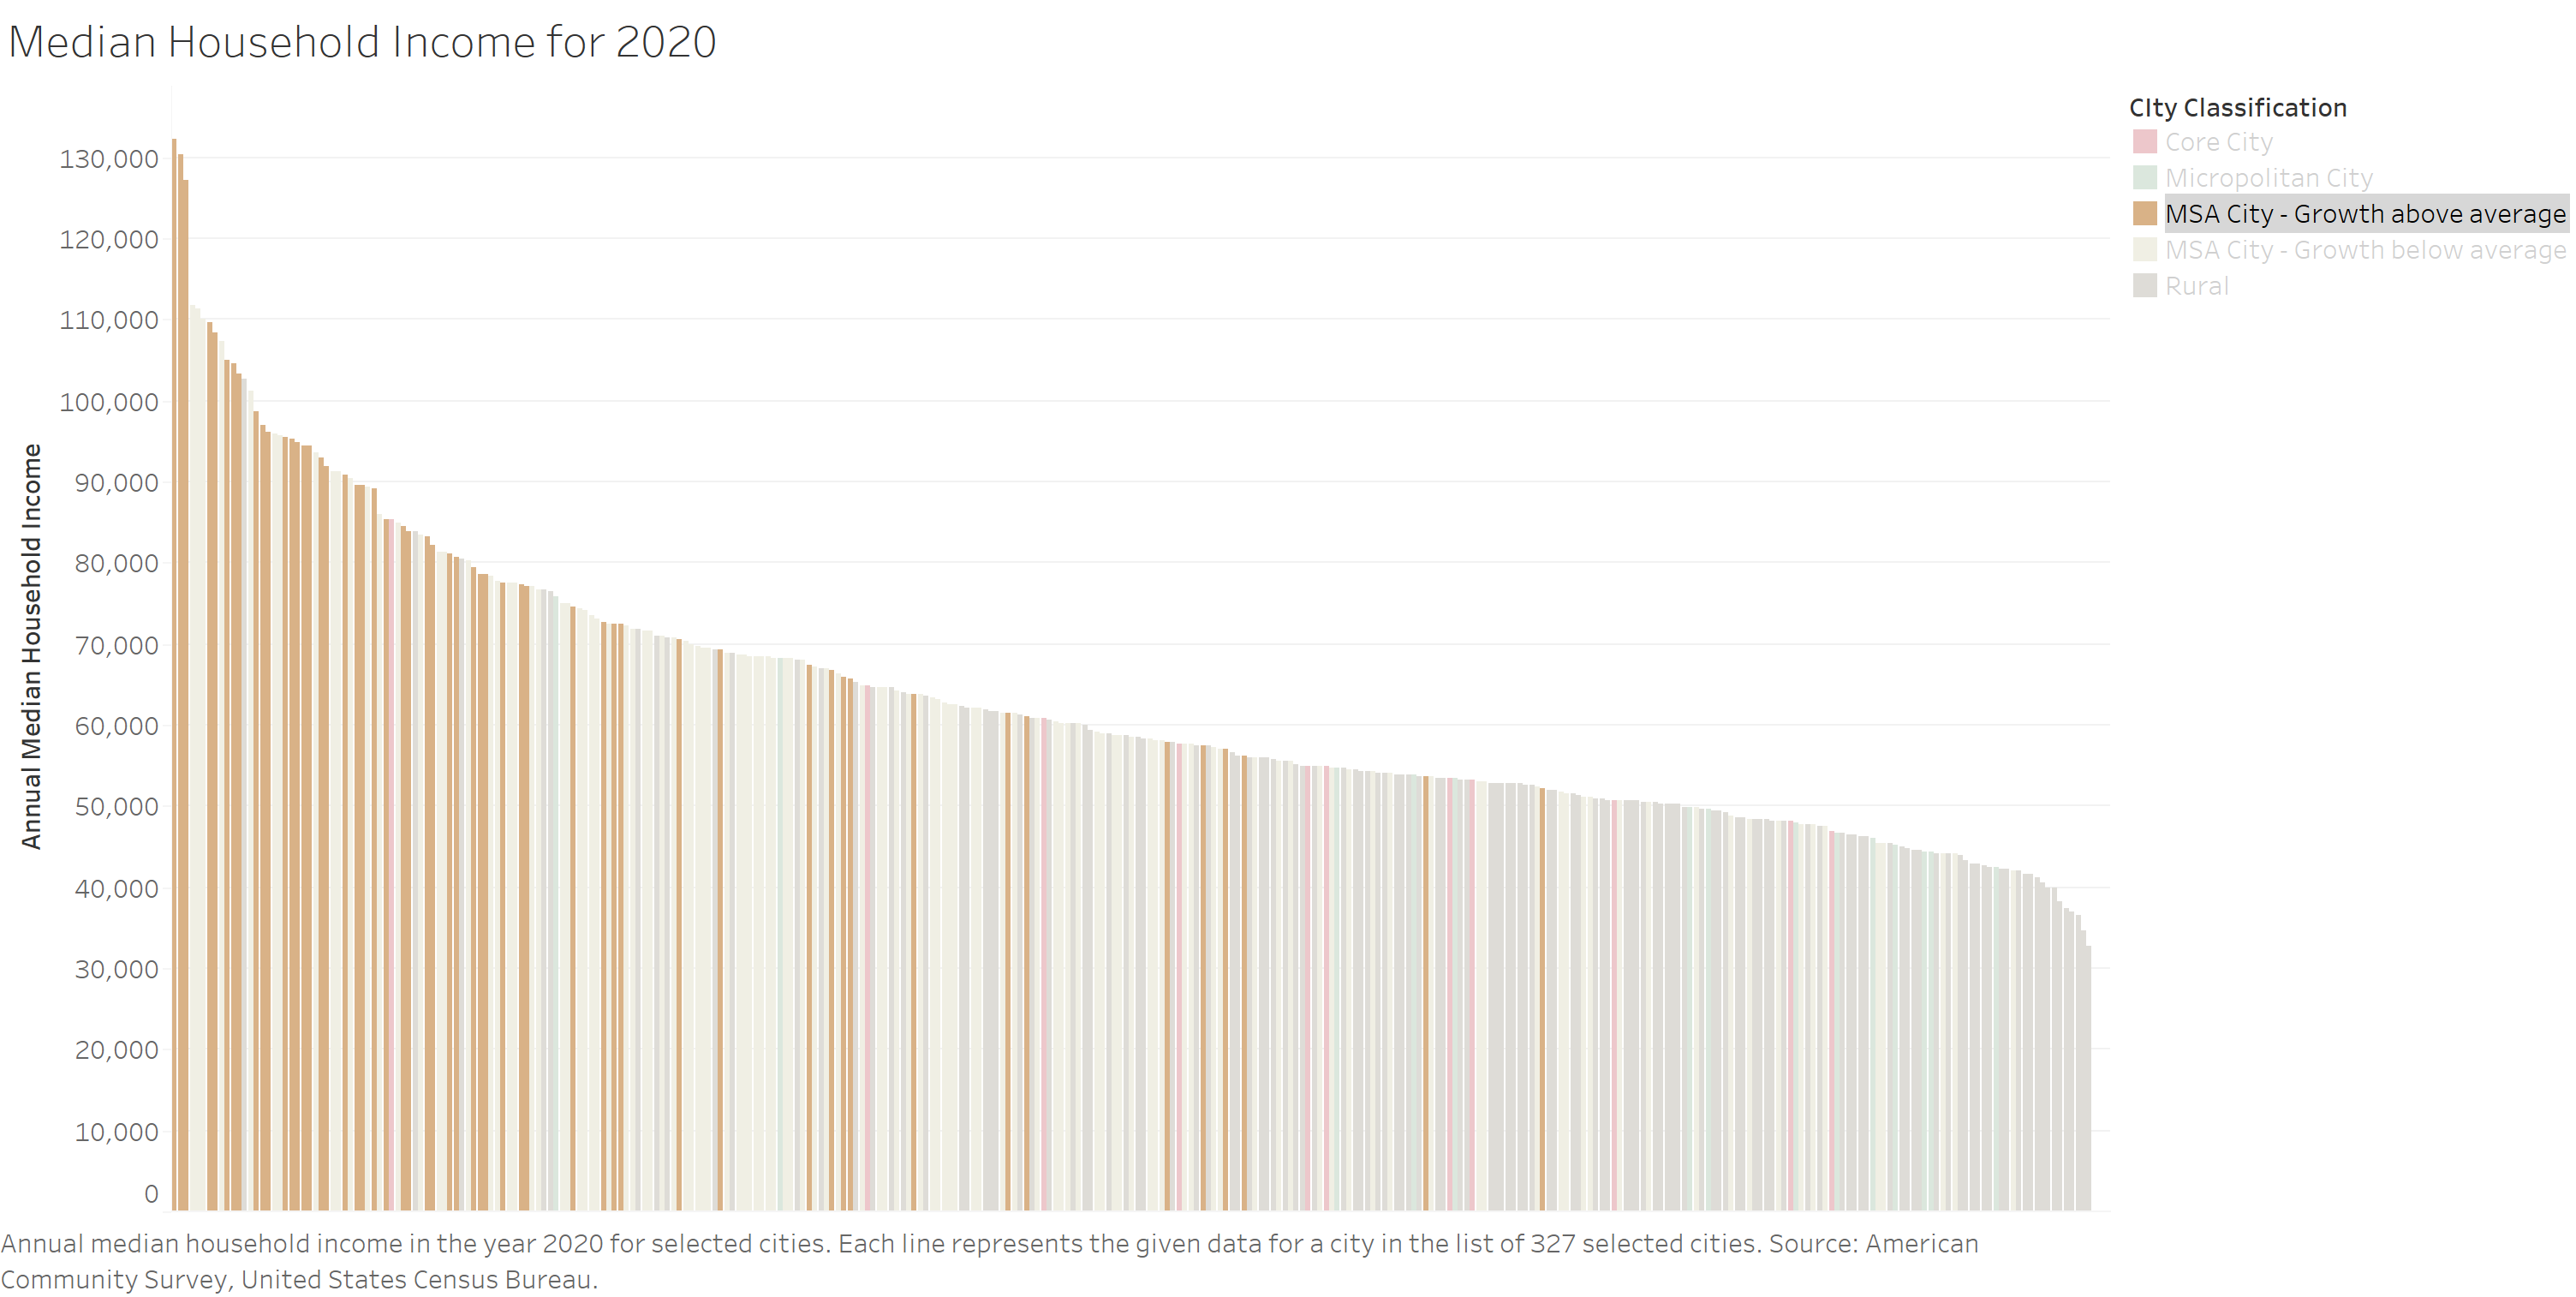
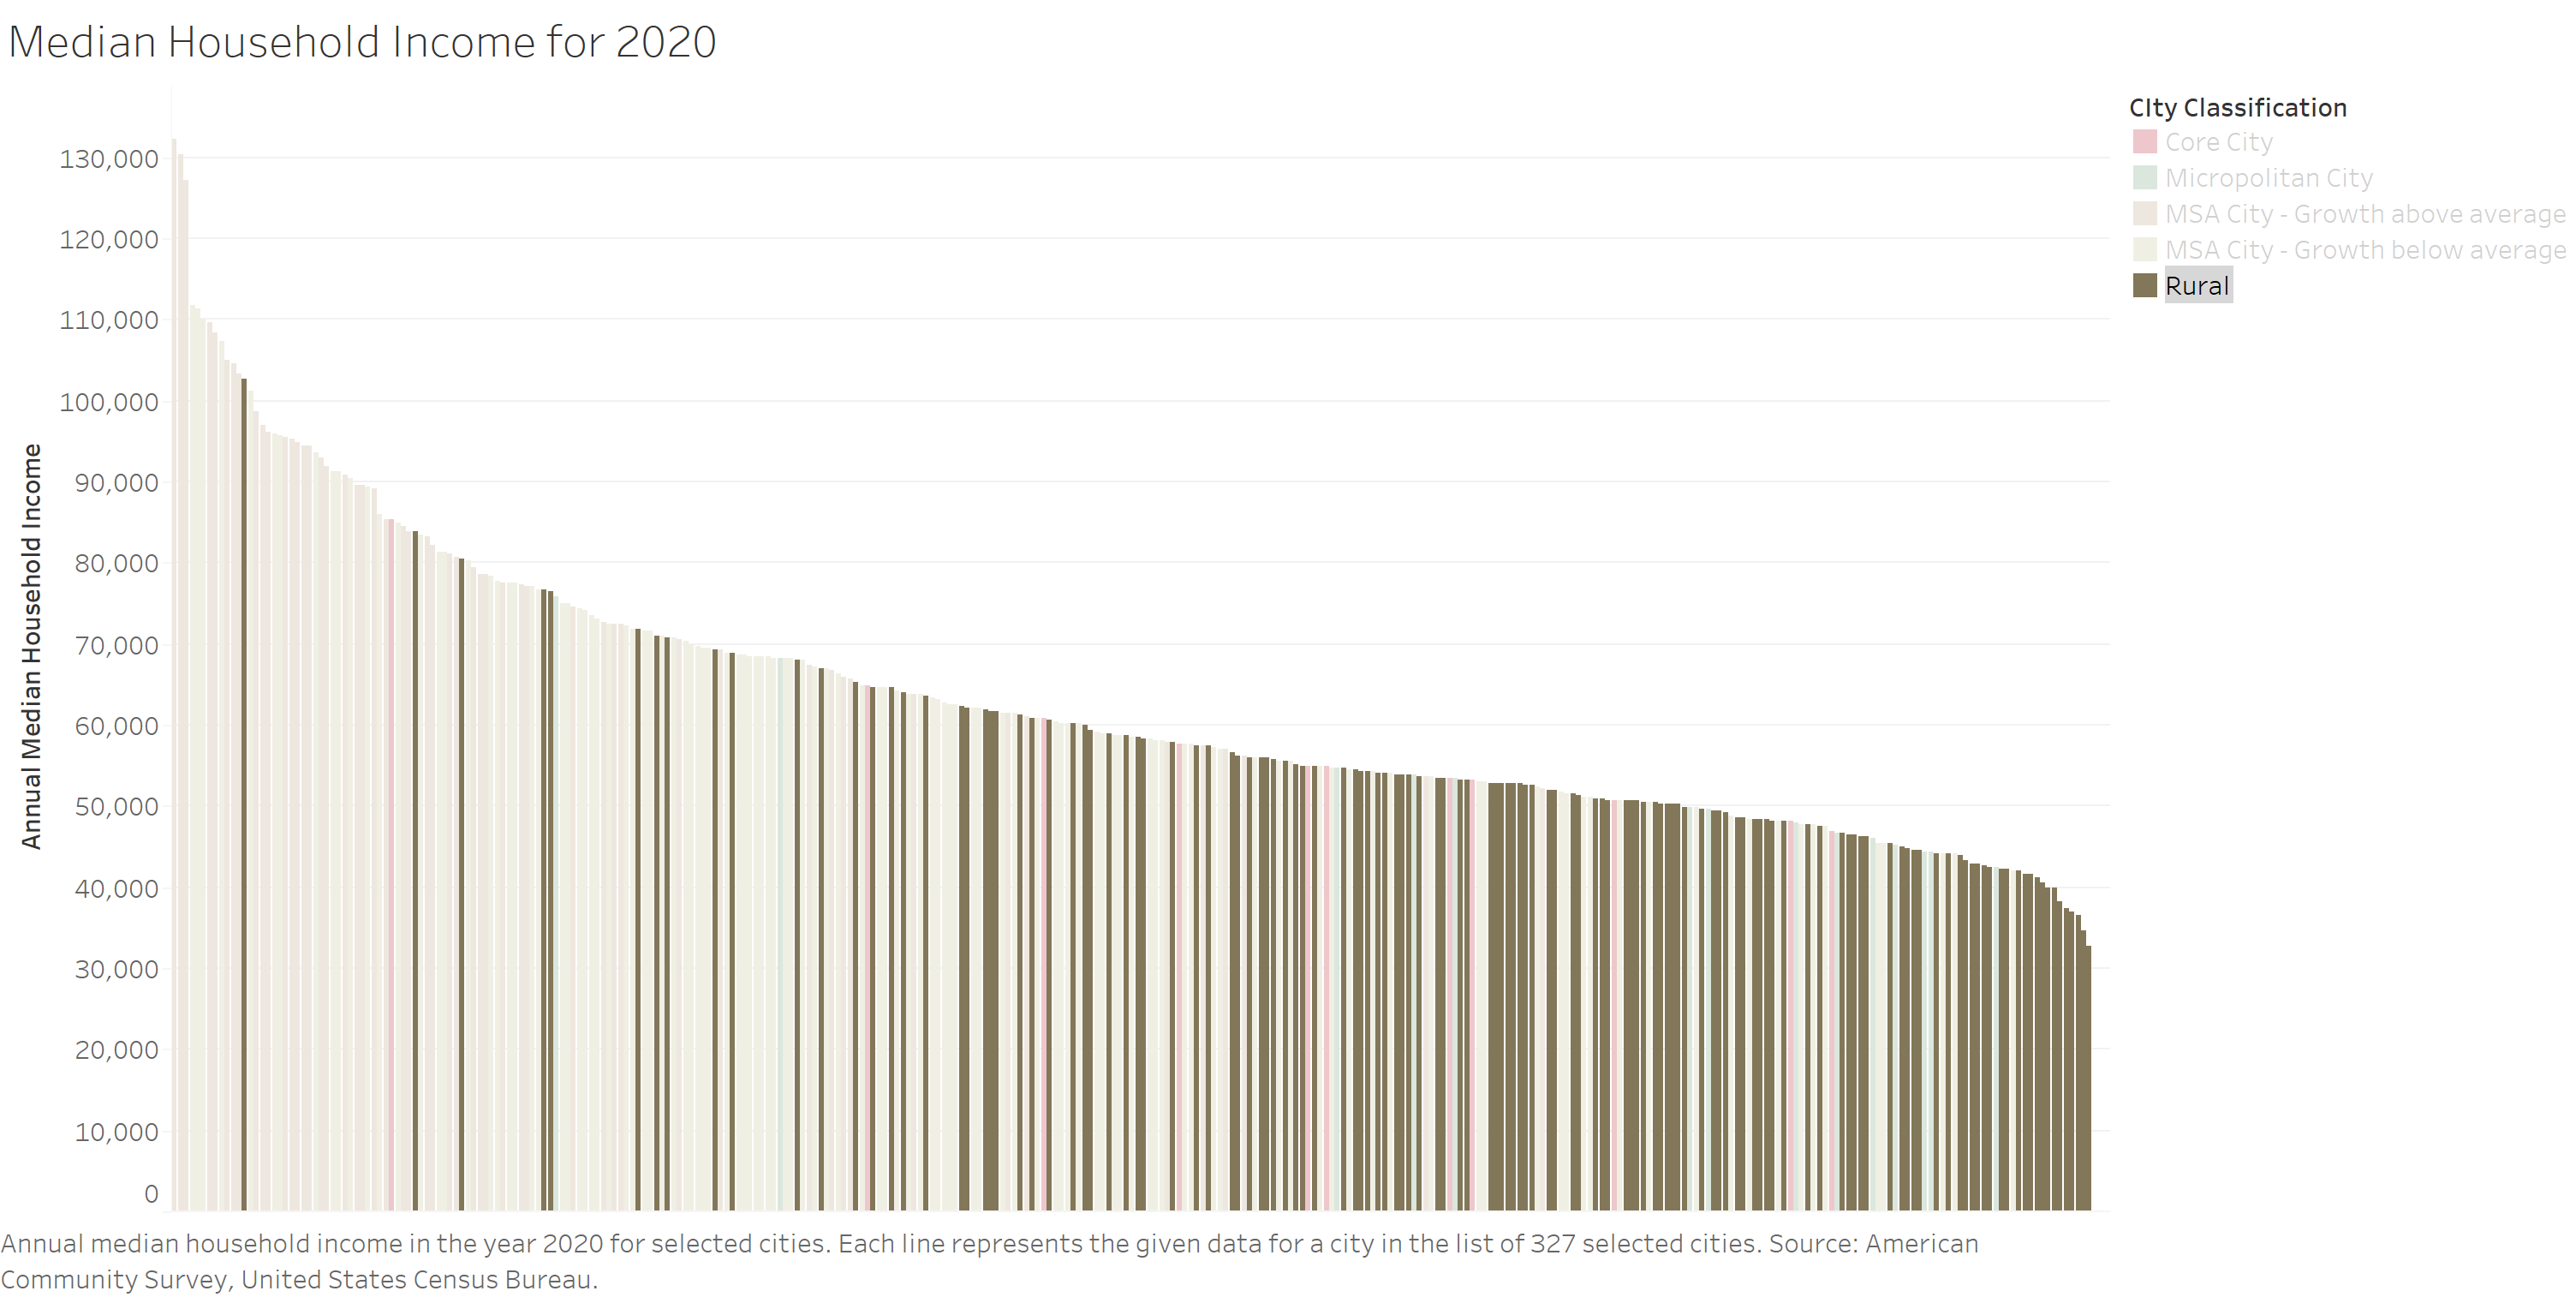
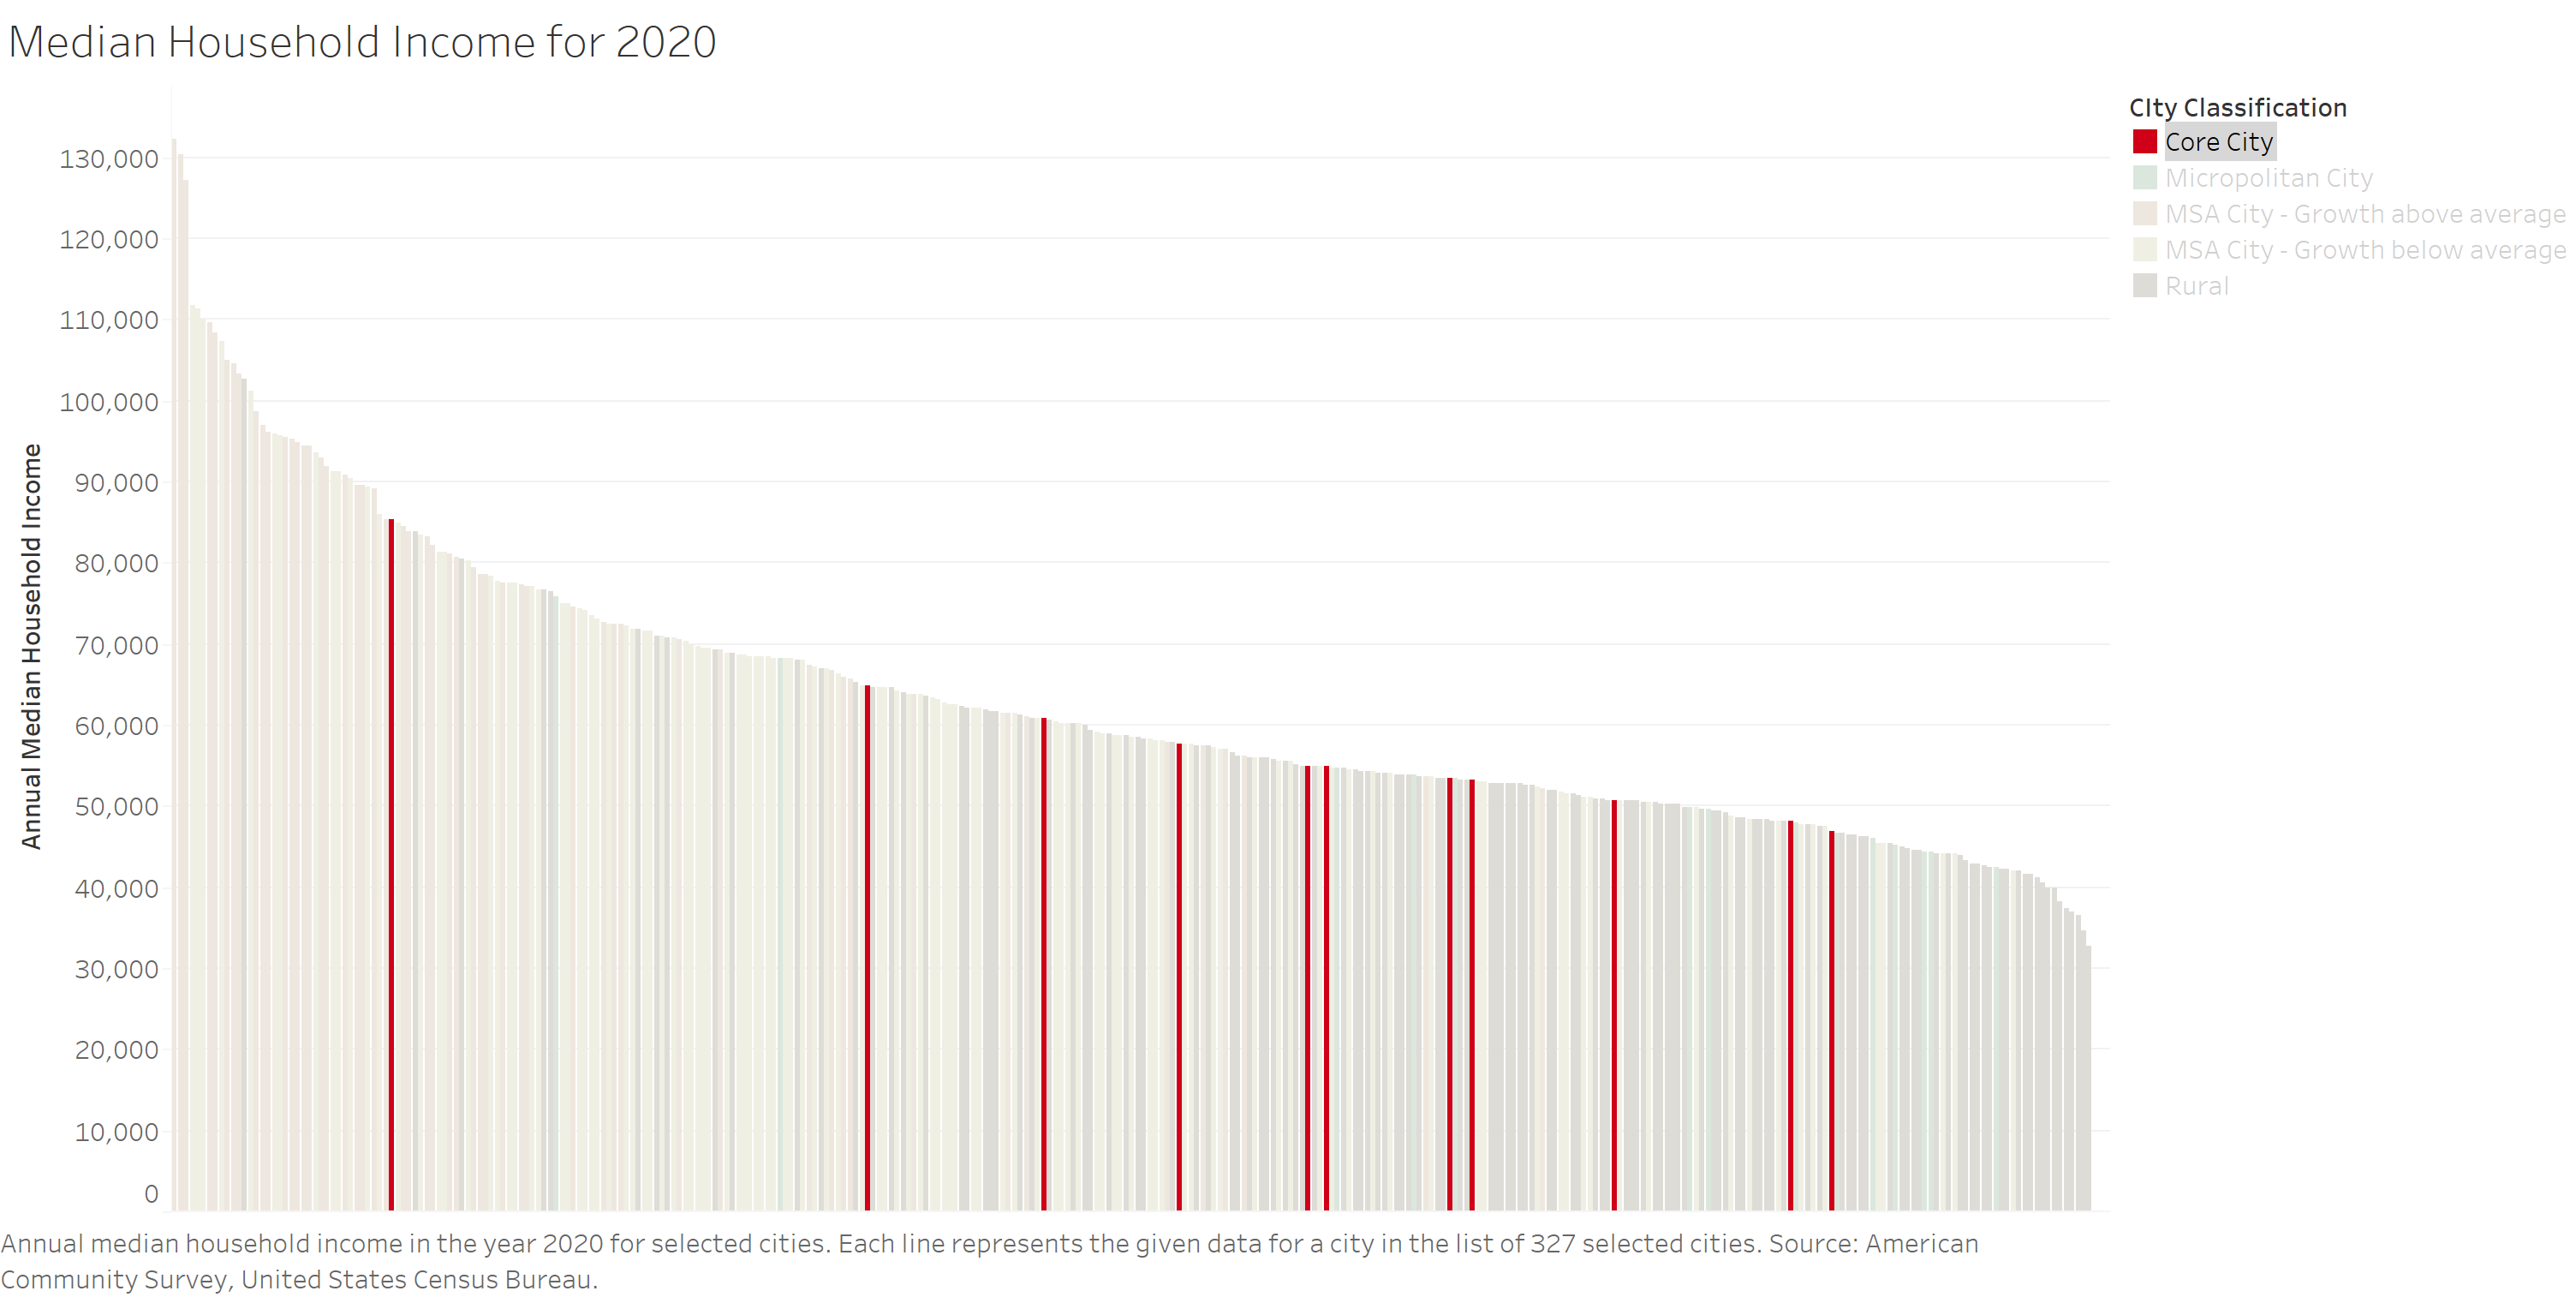
Median Income by City Classification
The median income is an important metric to consider when understanding the housing market. It can be used as a representation of the purchasing power of the residents of a city. The annual costs of homes and rentals means little without knowing how much one earns in a year. As seen below, metropolitan cities with above average growth consistently have the highest median incomes. The median of their median incomes is $7,216 per year higher than the second highest city classification, metropolitan cities with below average growth. Rural places account for a significant amount of the lowest median incomes. However, they have a large variance, and some rank among the highest median incomes. For core cities, 63% are below the 50th percentile with only one city, Bettendorf, ranking considerably higher. Although metropolitan cities with below average growth and micropolitan cities have interesting stories to tell of their own, they will not be included in this presentation to save time.
Click to expand the photos.
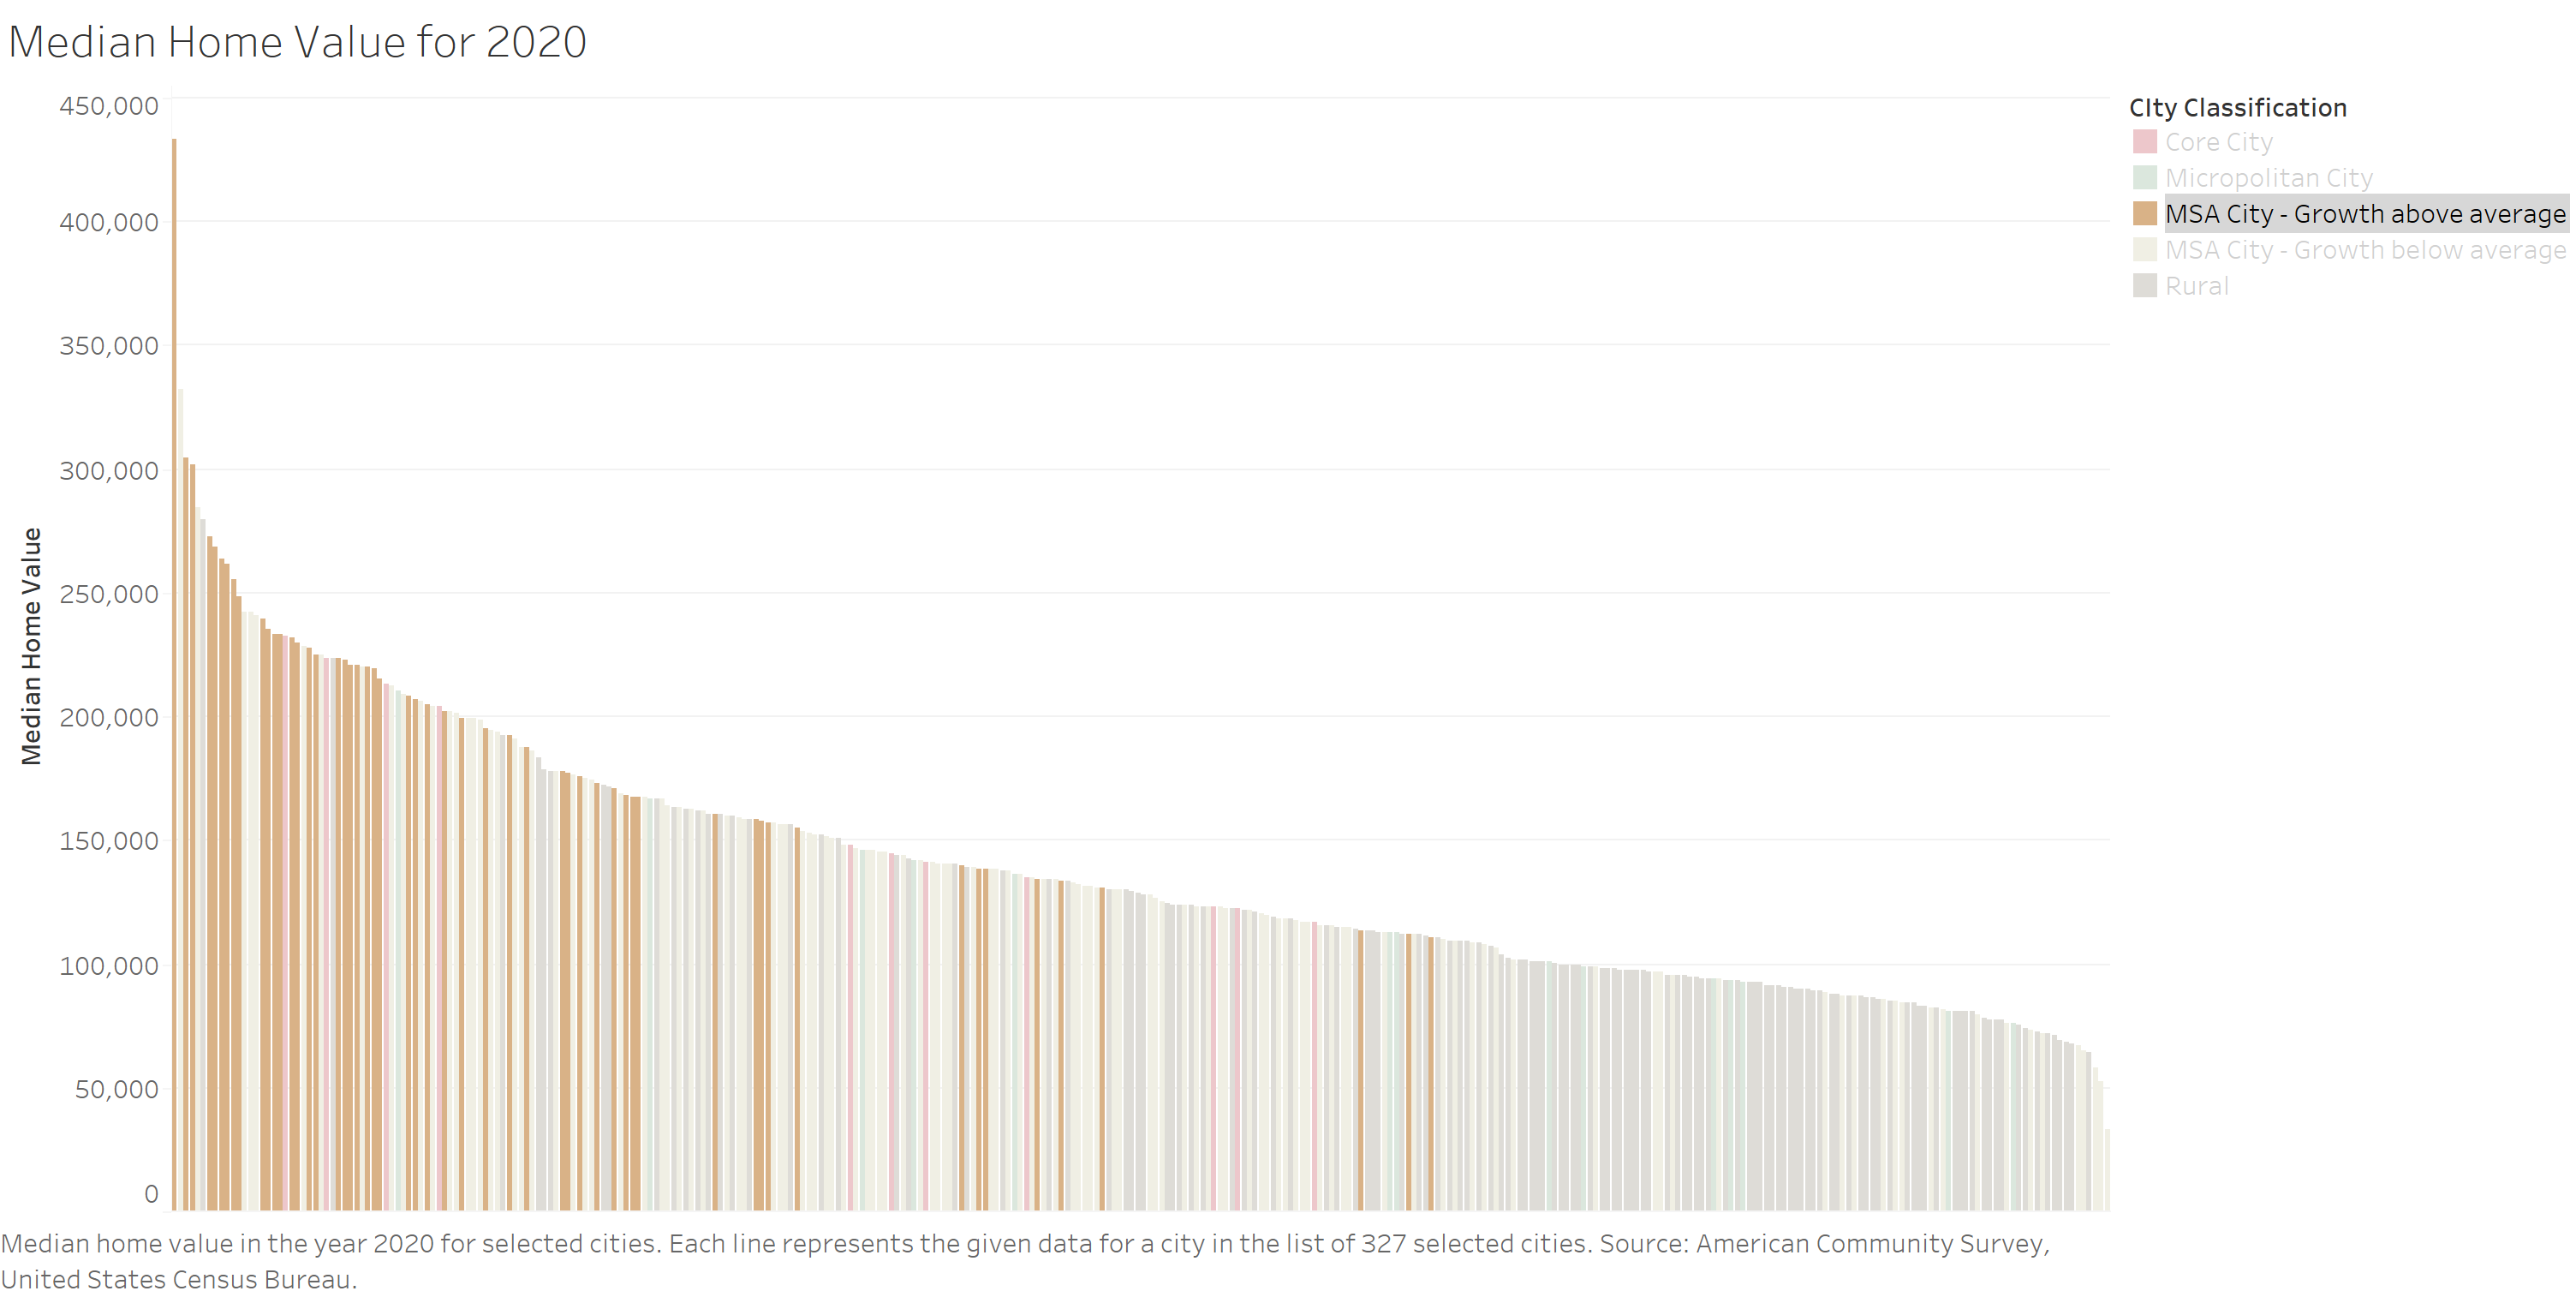
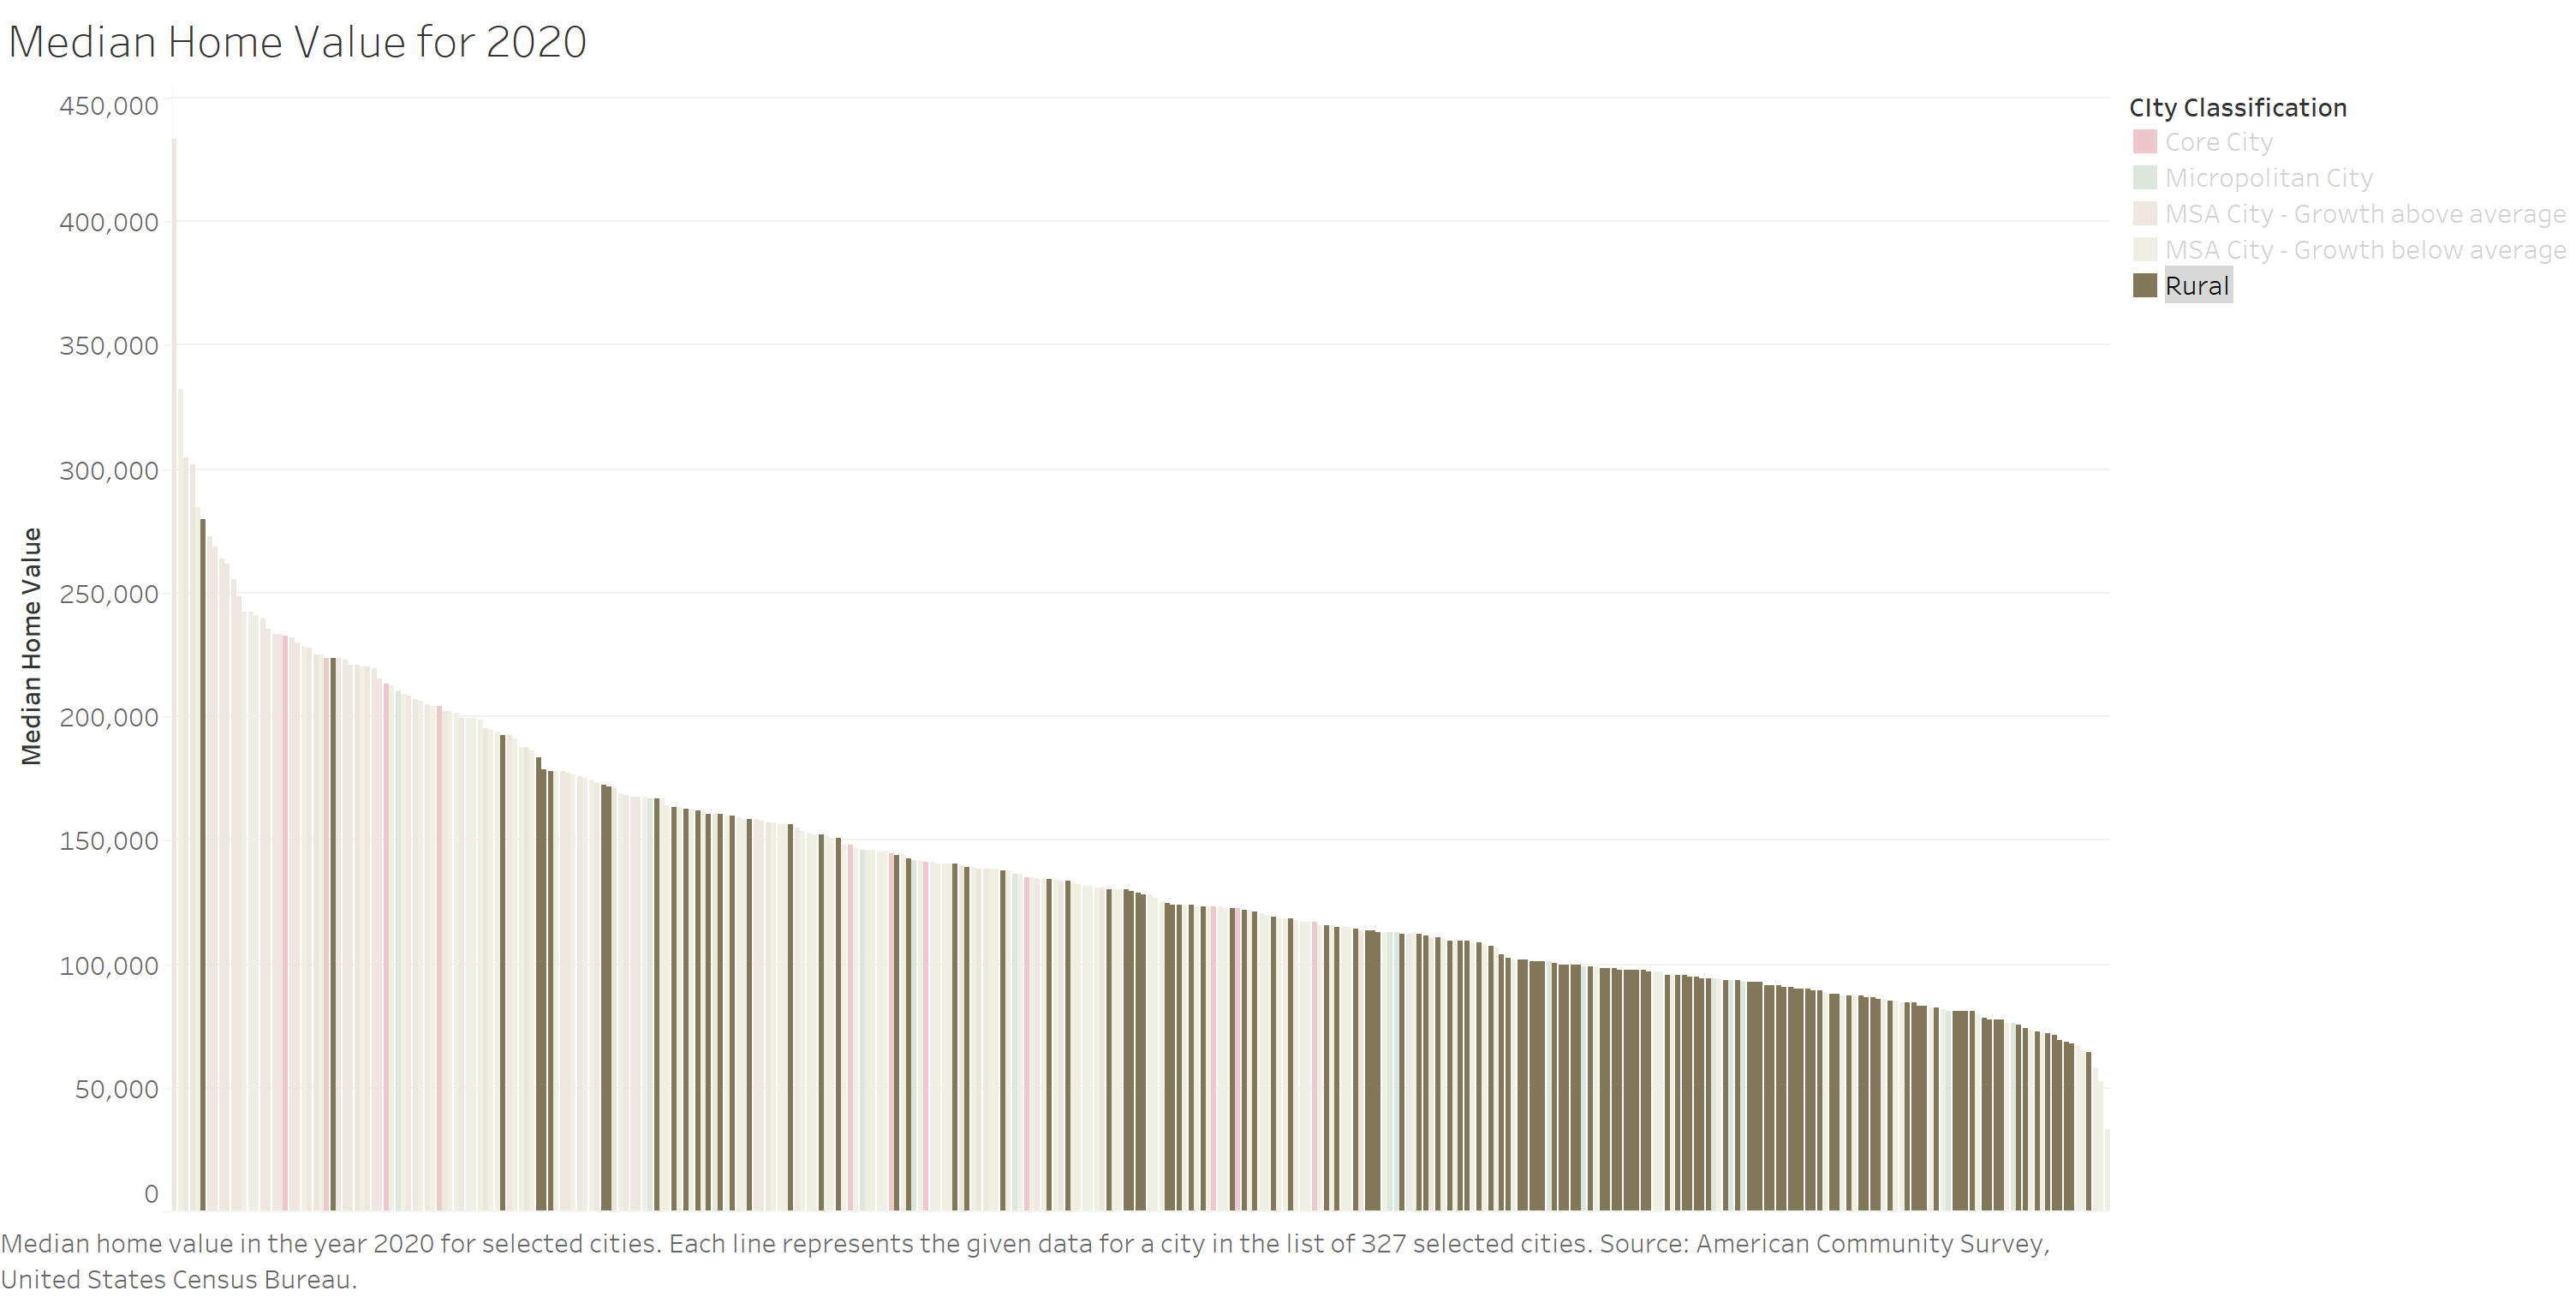
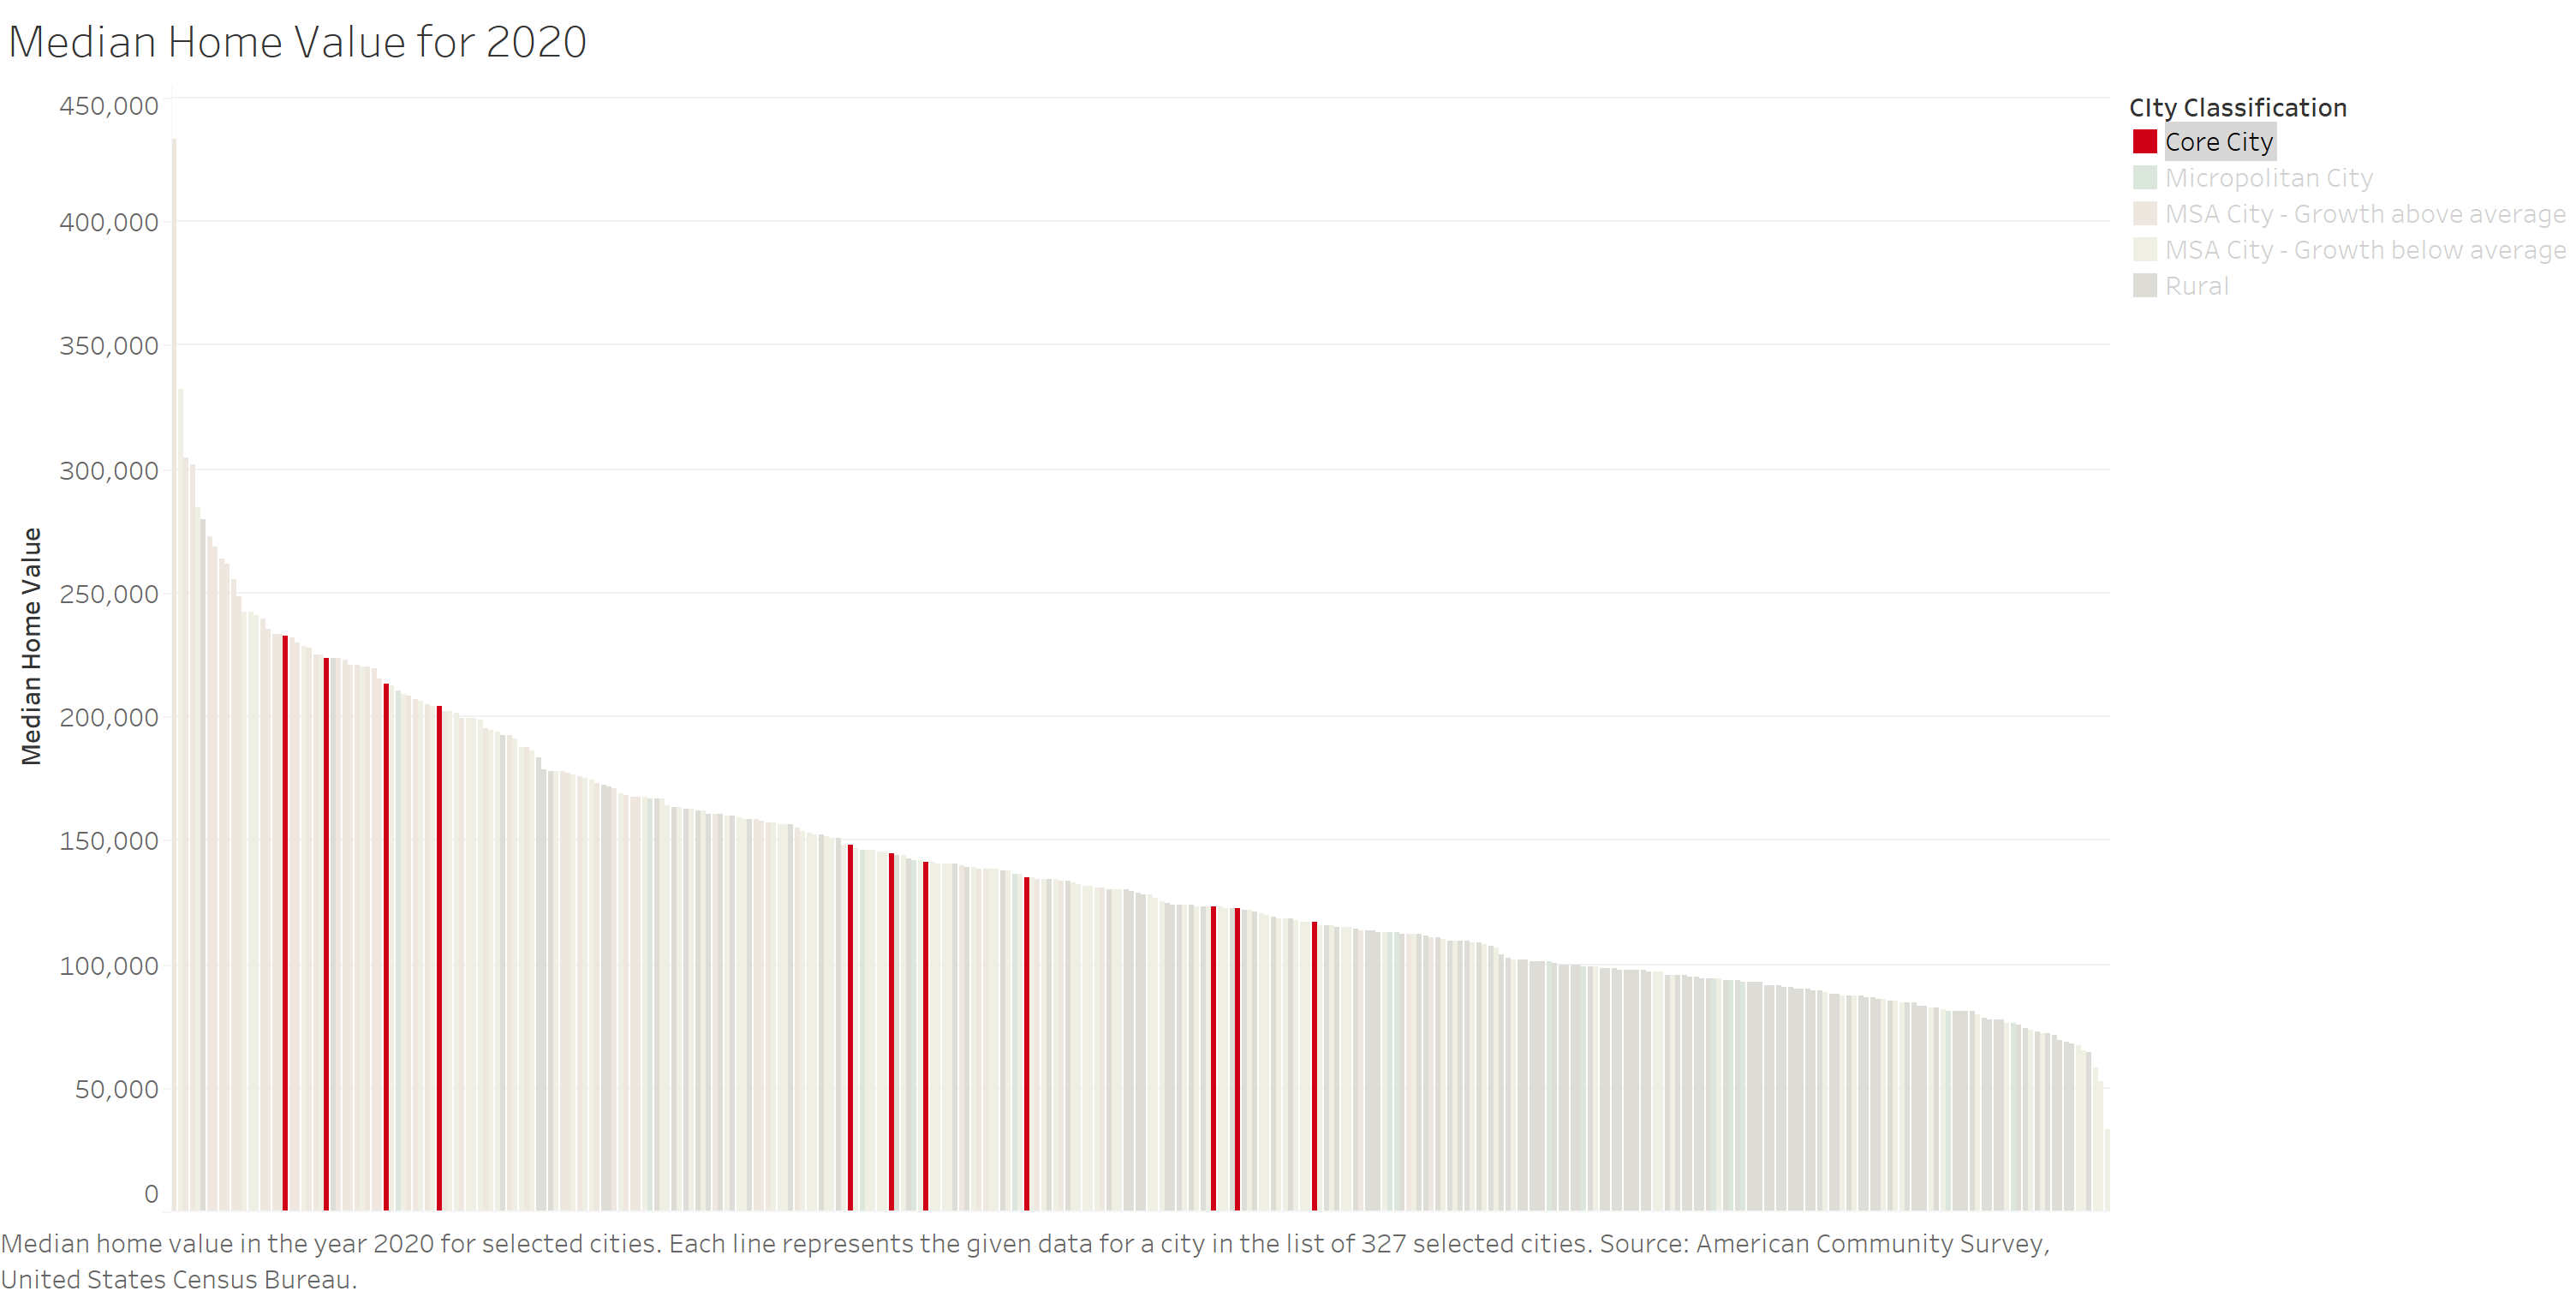
Median Home Value by City Classification
The values of homes are necessary for understanding housing affordability. The median home values of metropolitan cities with above-average growth again tend to be the highest of any classification, particularly in Shueyville with a median income of $433,000. This is over $100,000 higher than the second highest city. The high median home value could be result of a small sample size. The population of Shueyville is 731 as of 2020. However, the margin of error for Shueyville is relatively low. The median home value follows a similar pattern as median income for rural places. The rural places make up a large part of the lower home values, yet they still reach some of the highest spots on the list. For example, Kent Estates has the sixth median home value.
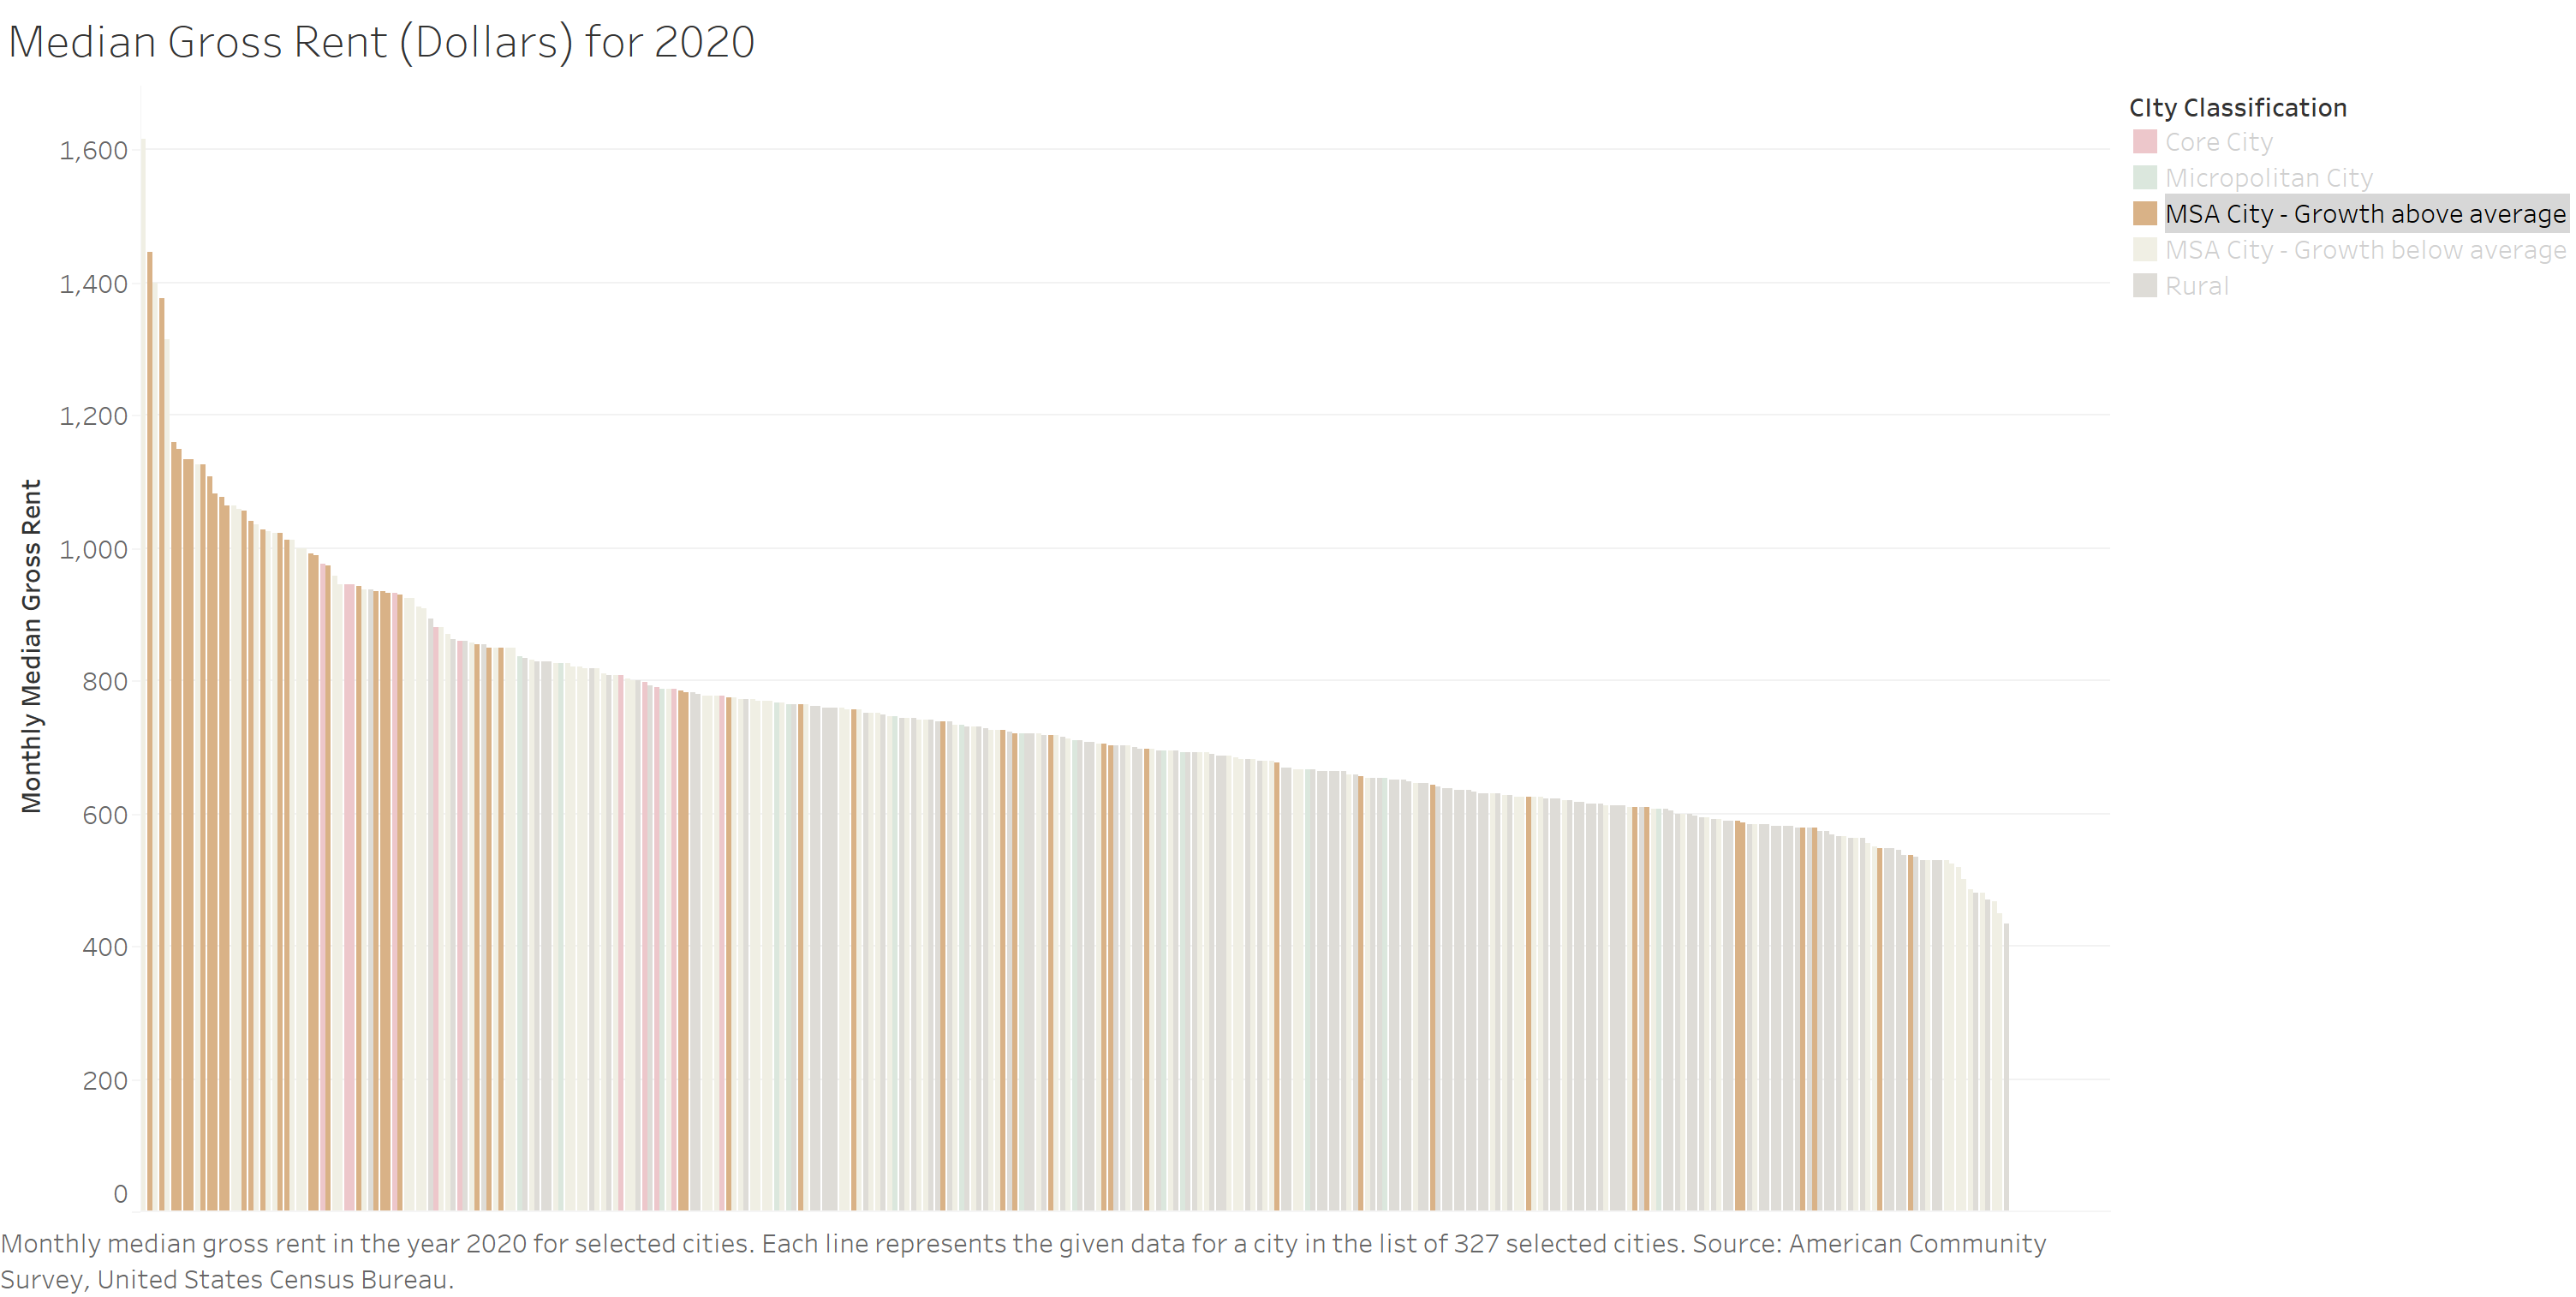
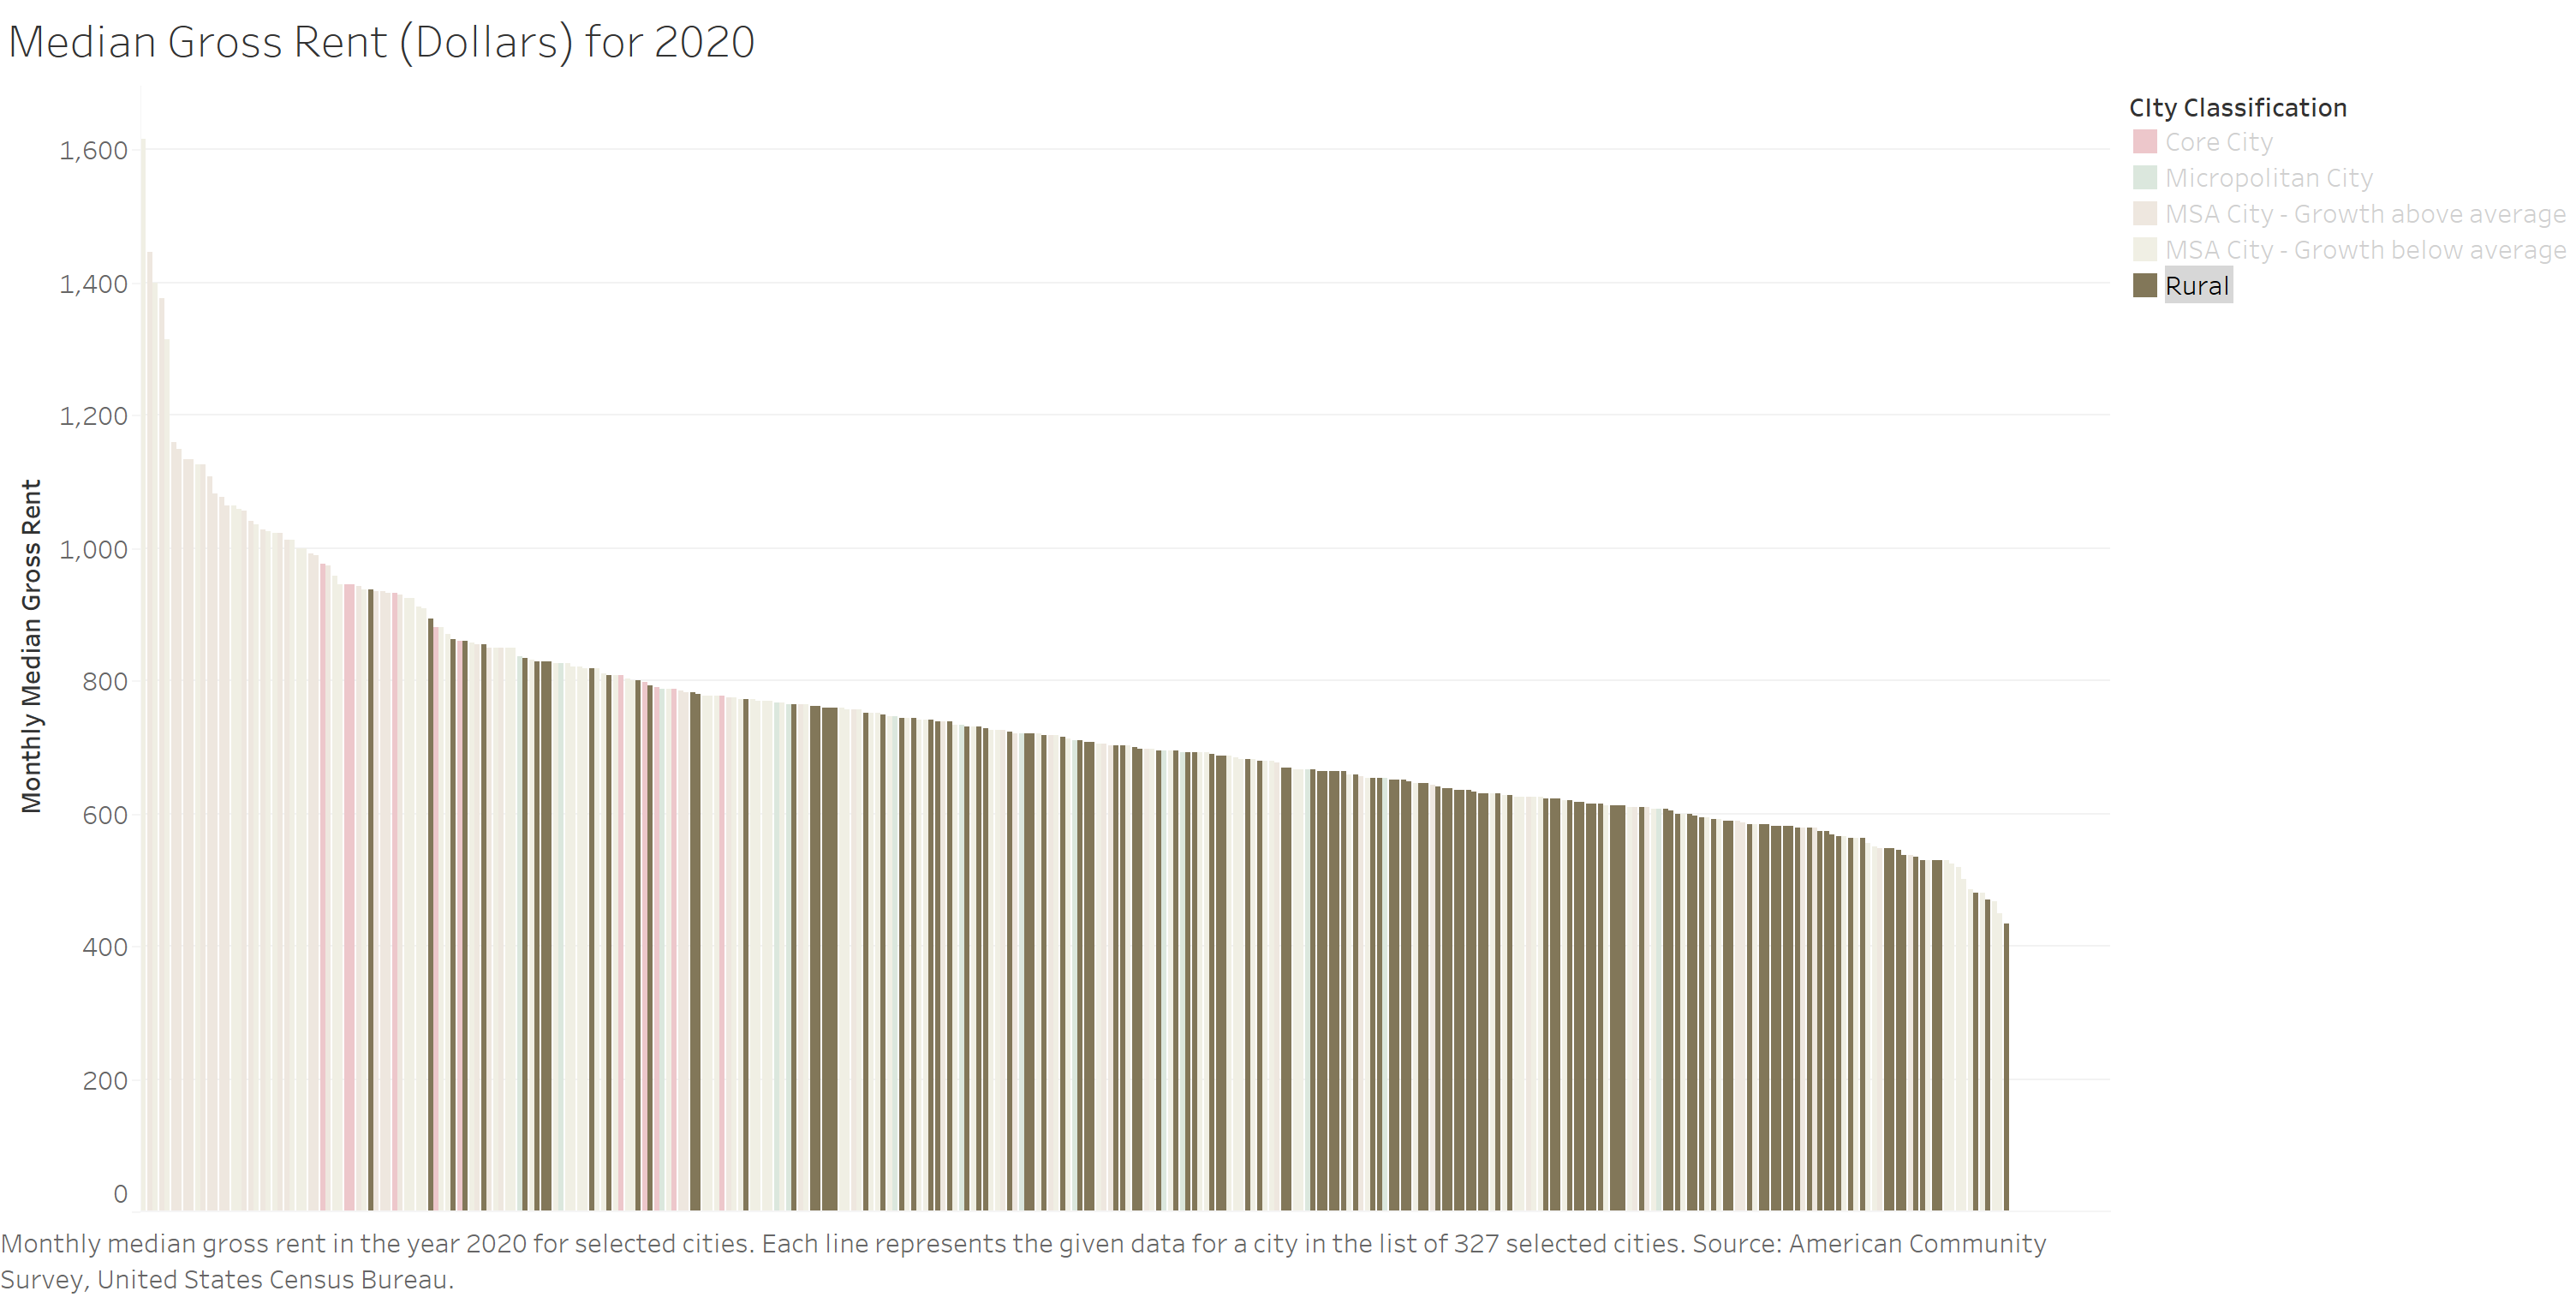
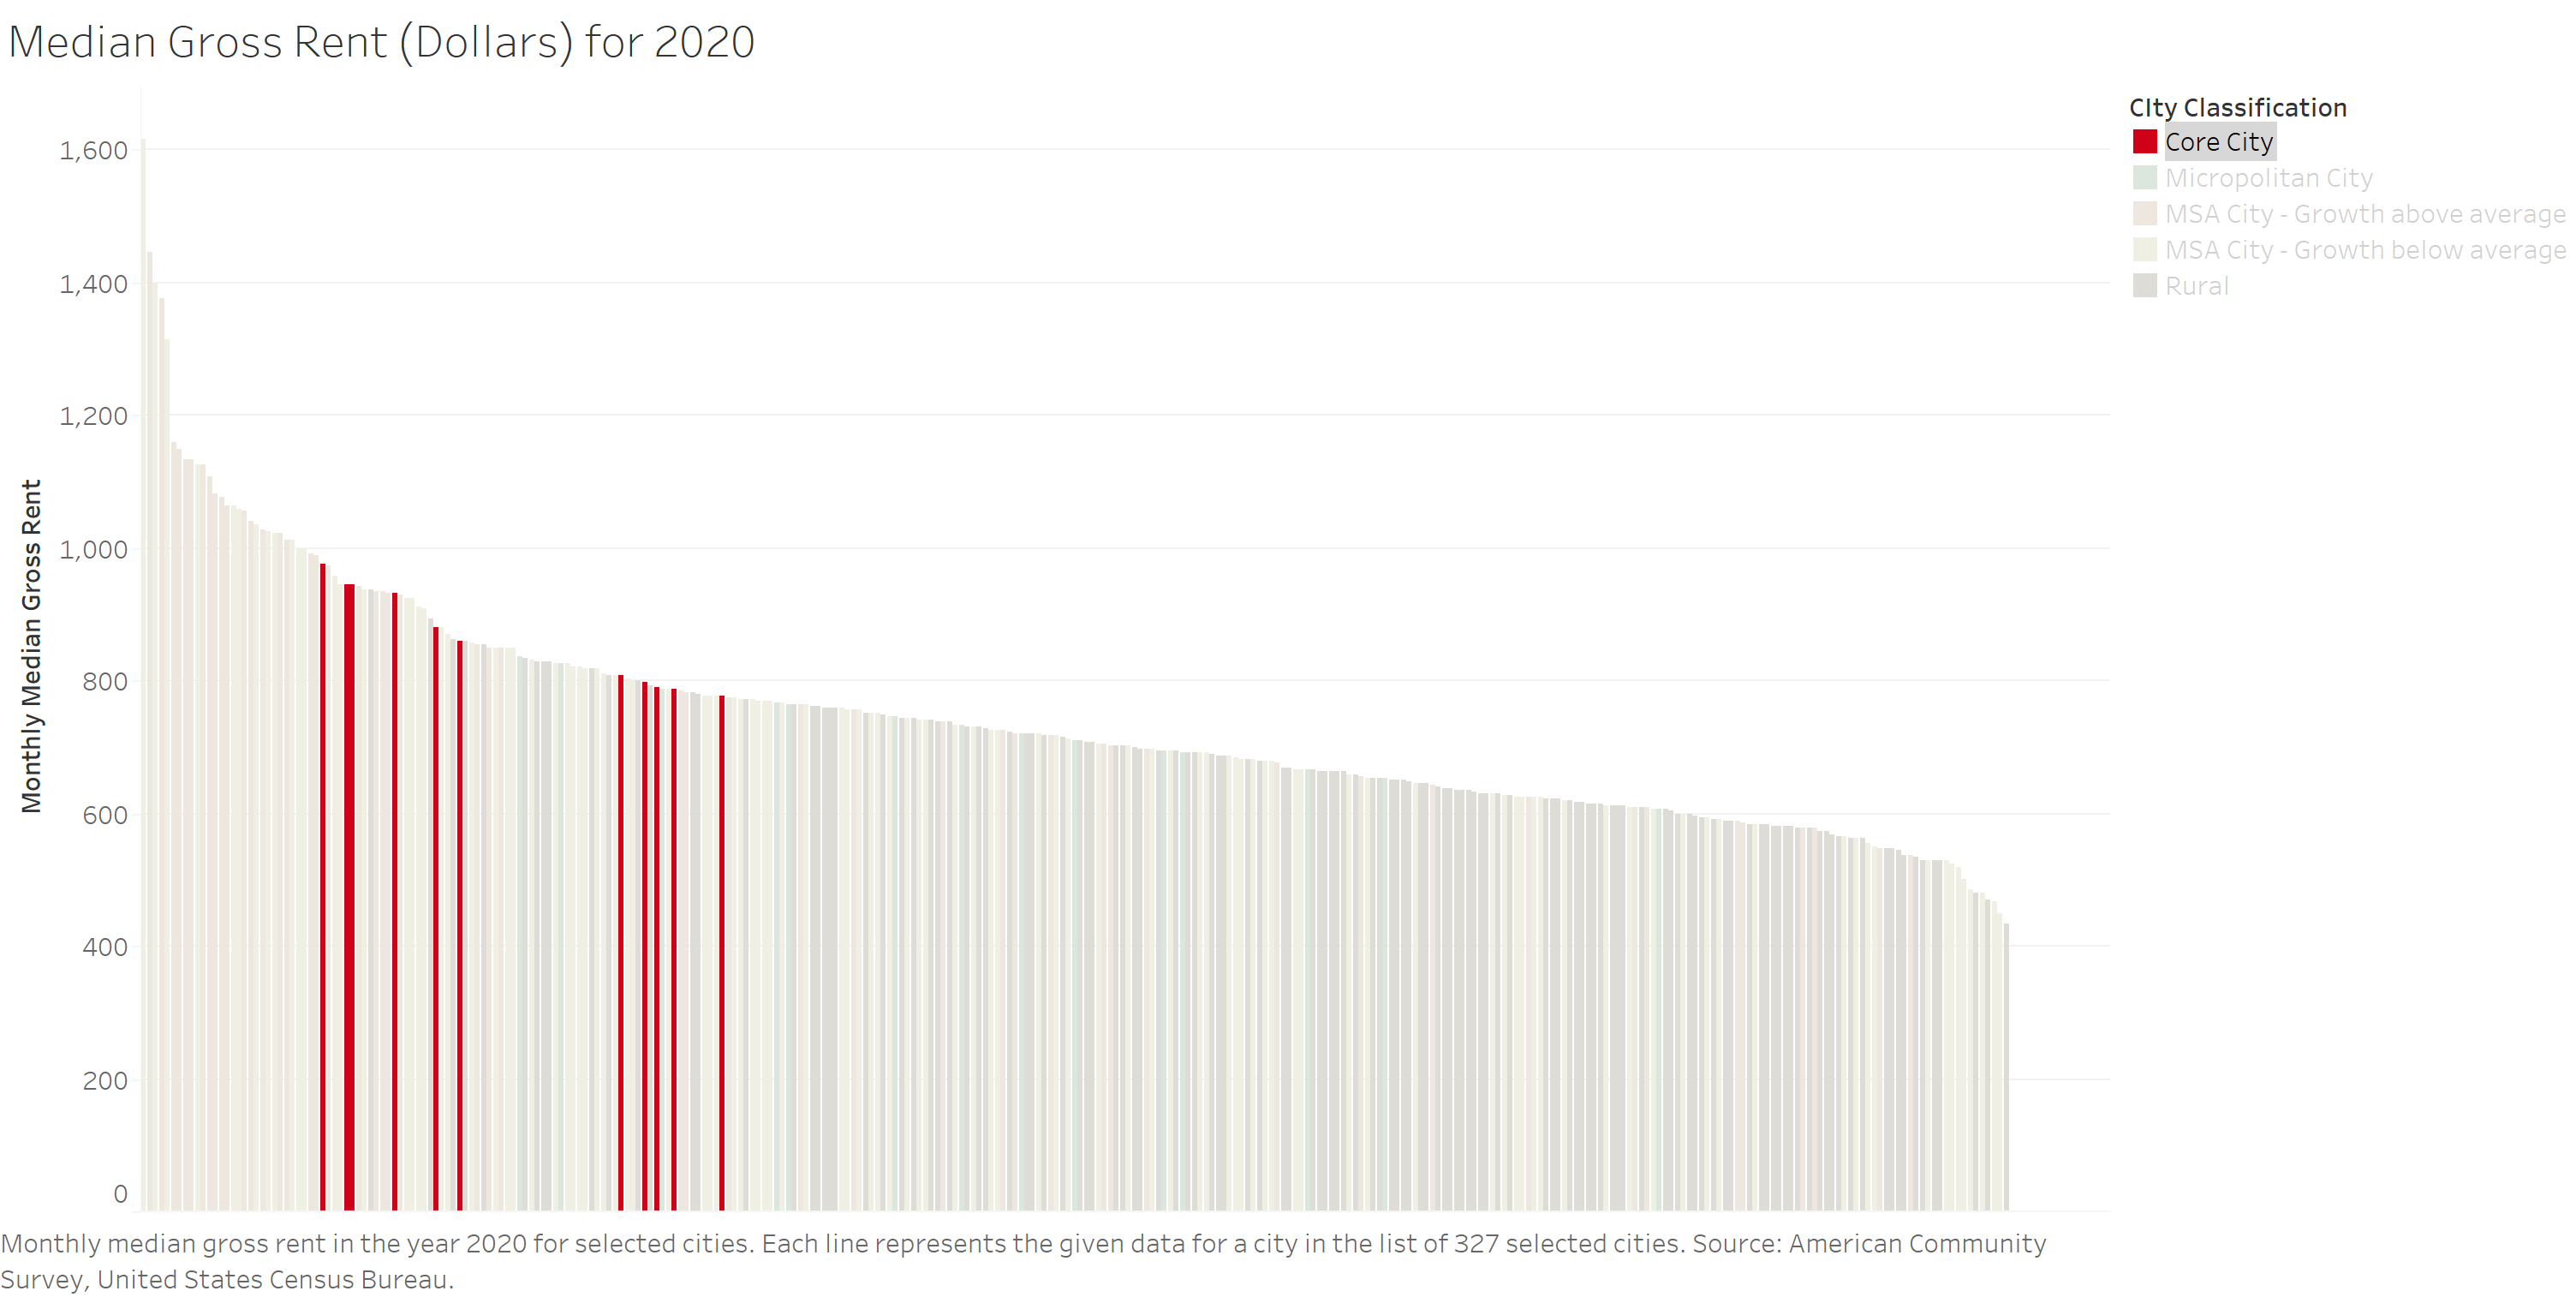
Median Gross Rent by City Classification
Gross rent is the amount of money a renter pays on their lease each month before subtracting additional costs, such as utilities. The vast majority of Iowans are homeowners, but renting is still common. The same pattern appears that was seen for median income and median home value. The metropolitan cities with above-average growth account for many of the highest median rents, whereas rural places account for many of the lowest median rents. The core cities form a tight cluster (or potentially 2 clusters) of high rents. Why are the values for the core cities’ median rents so close?
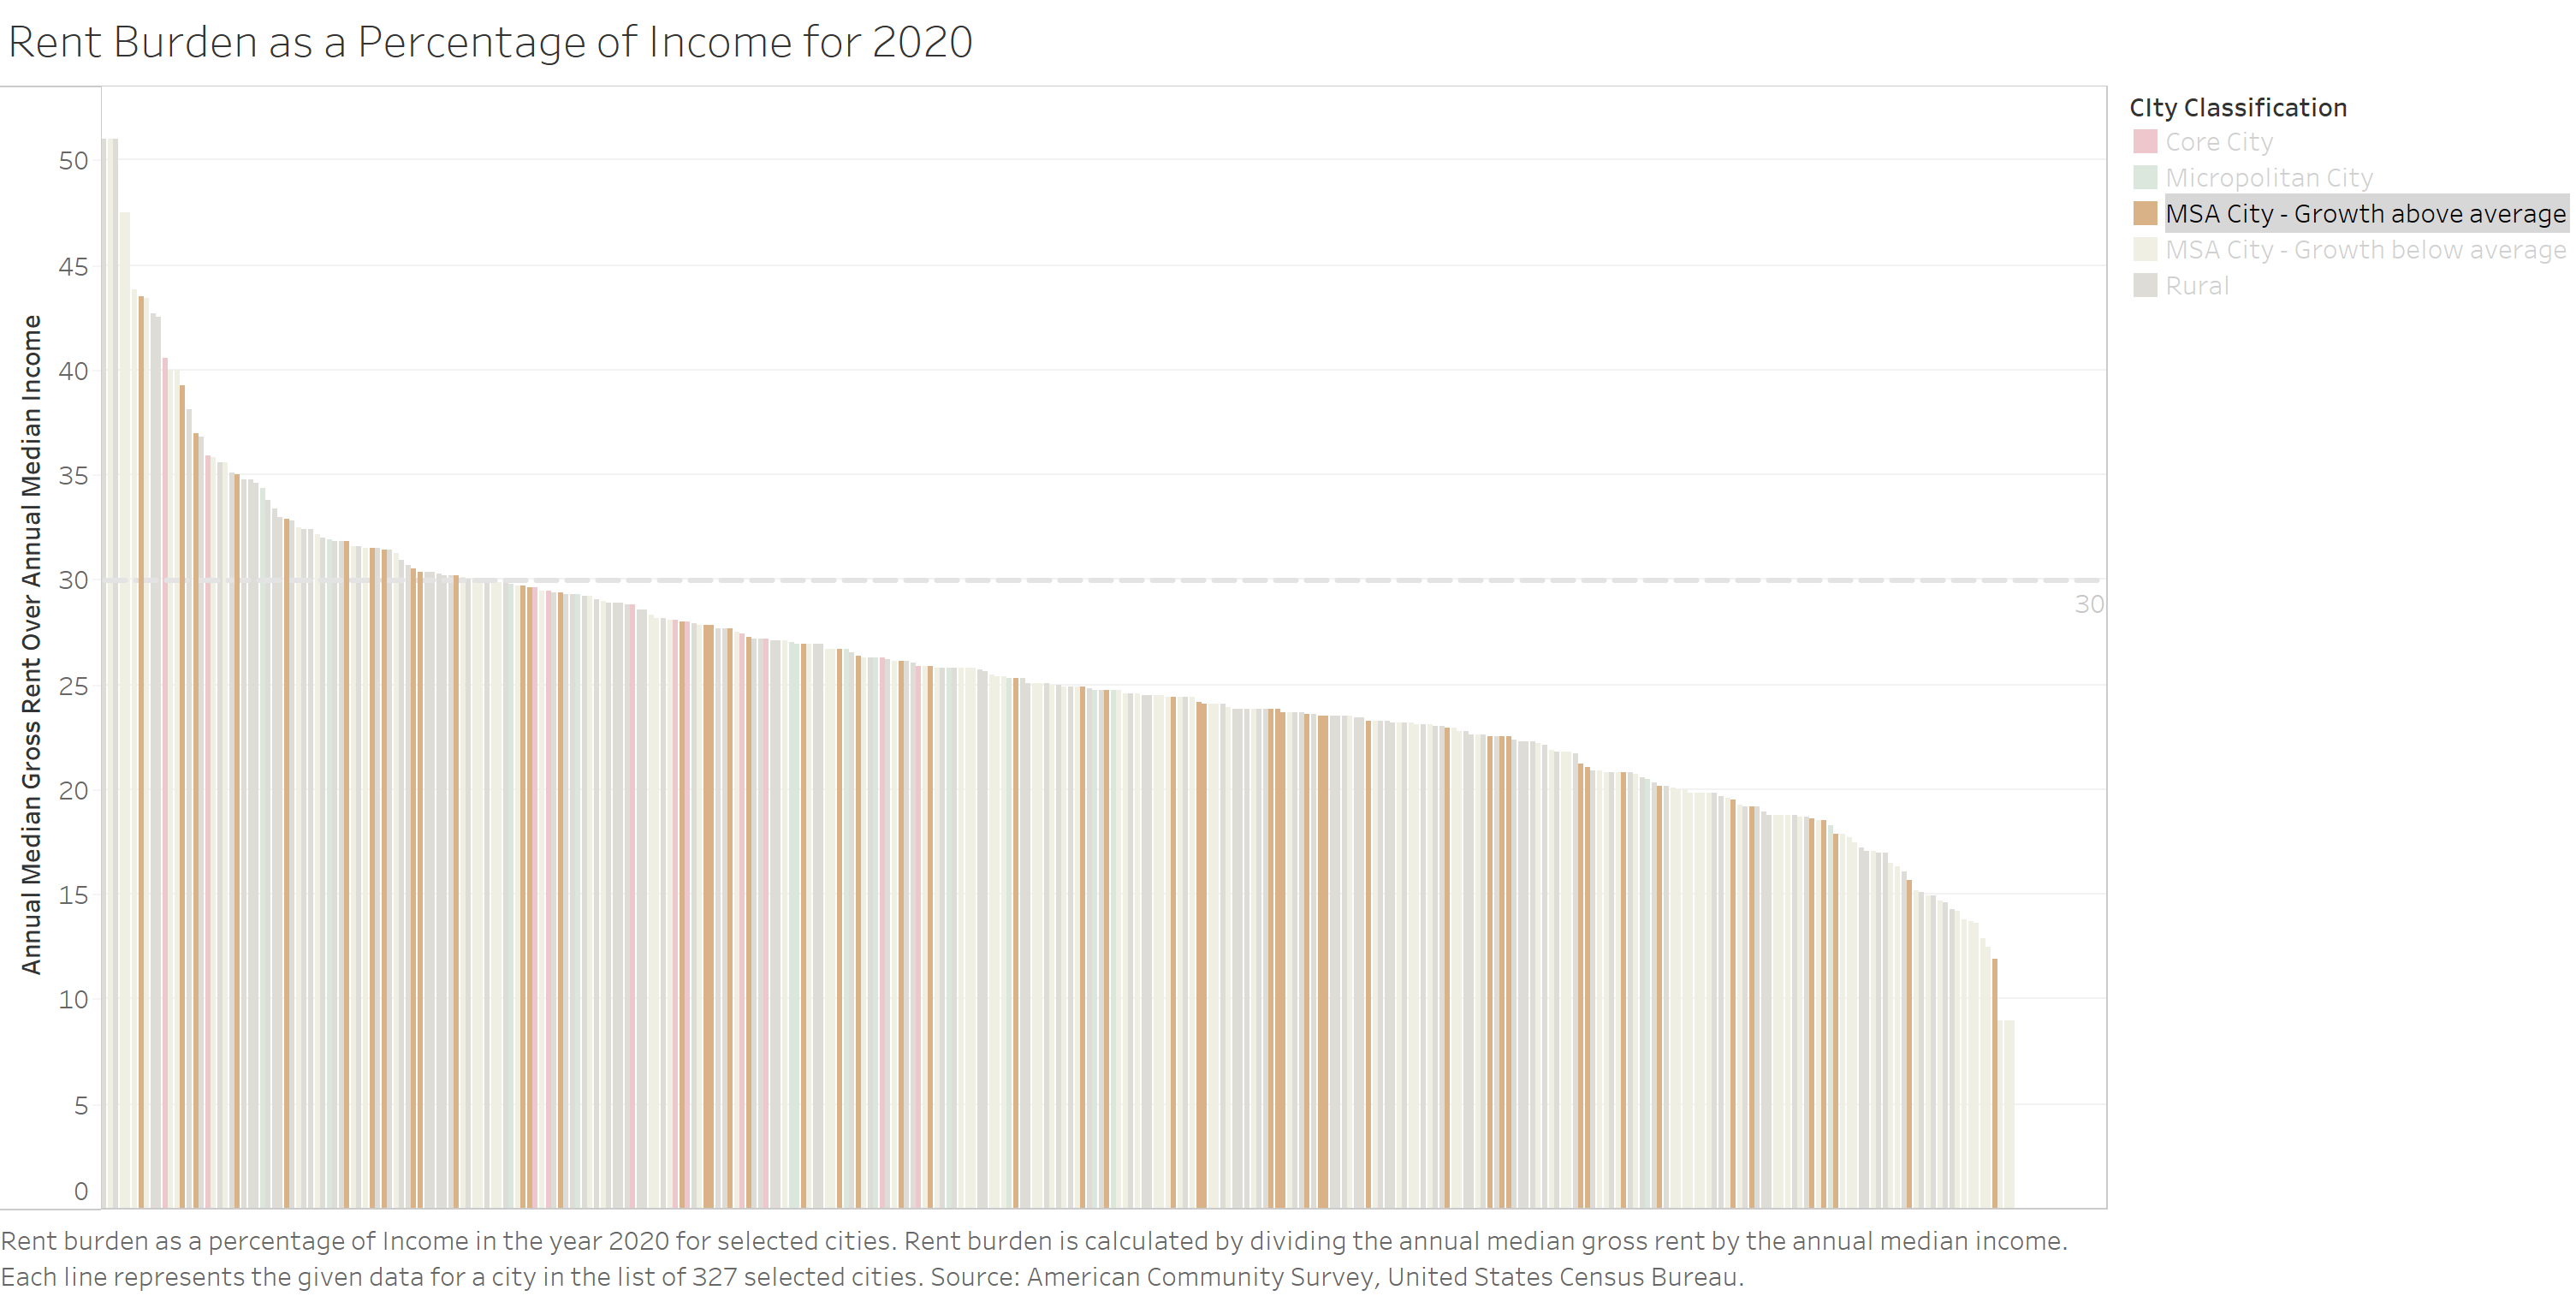
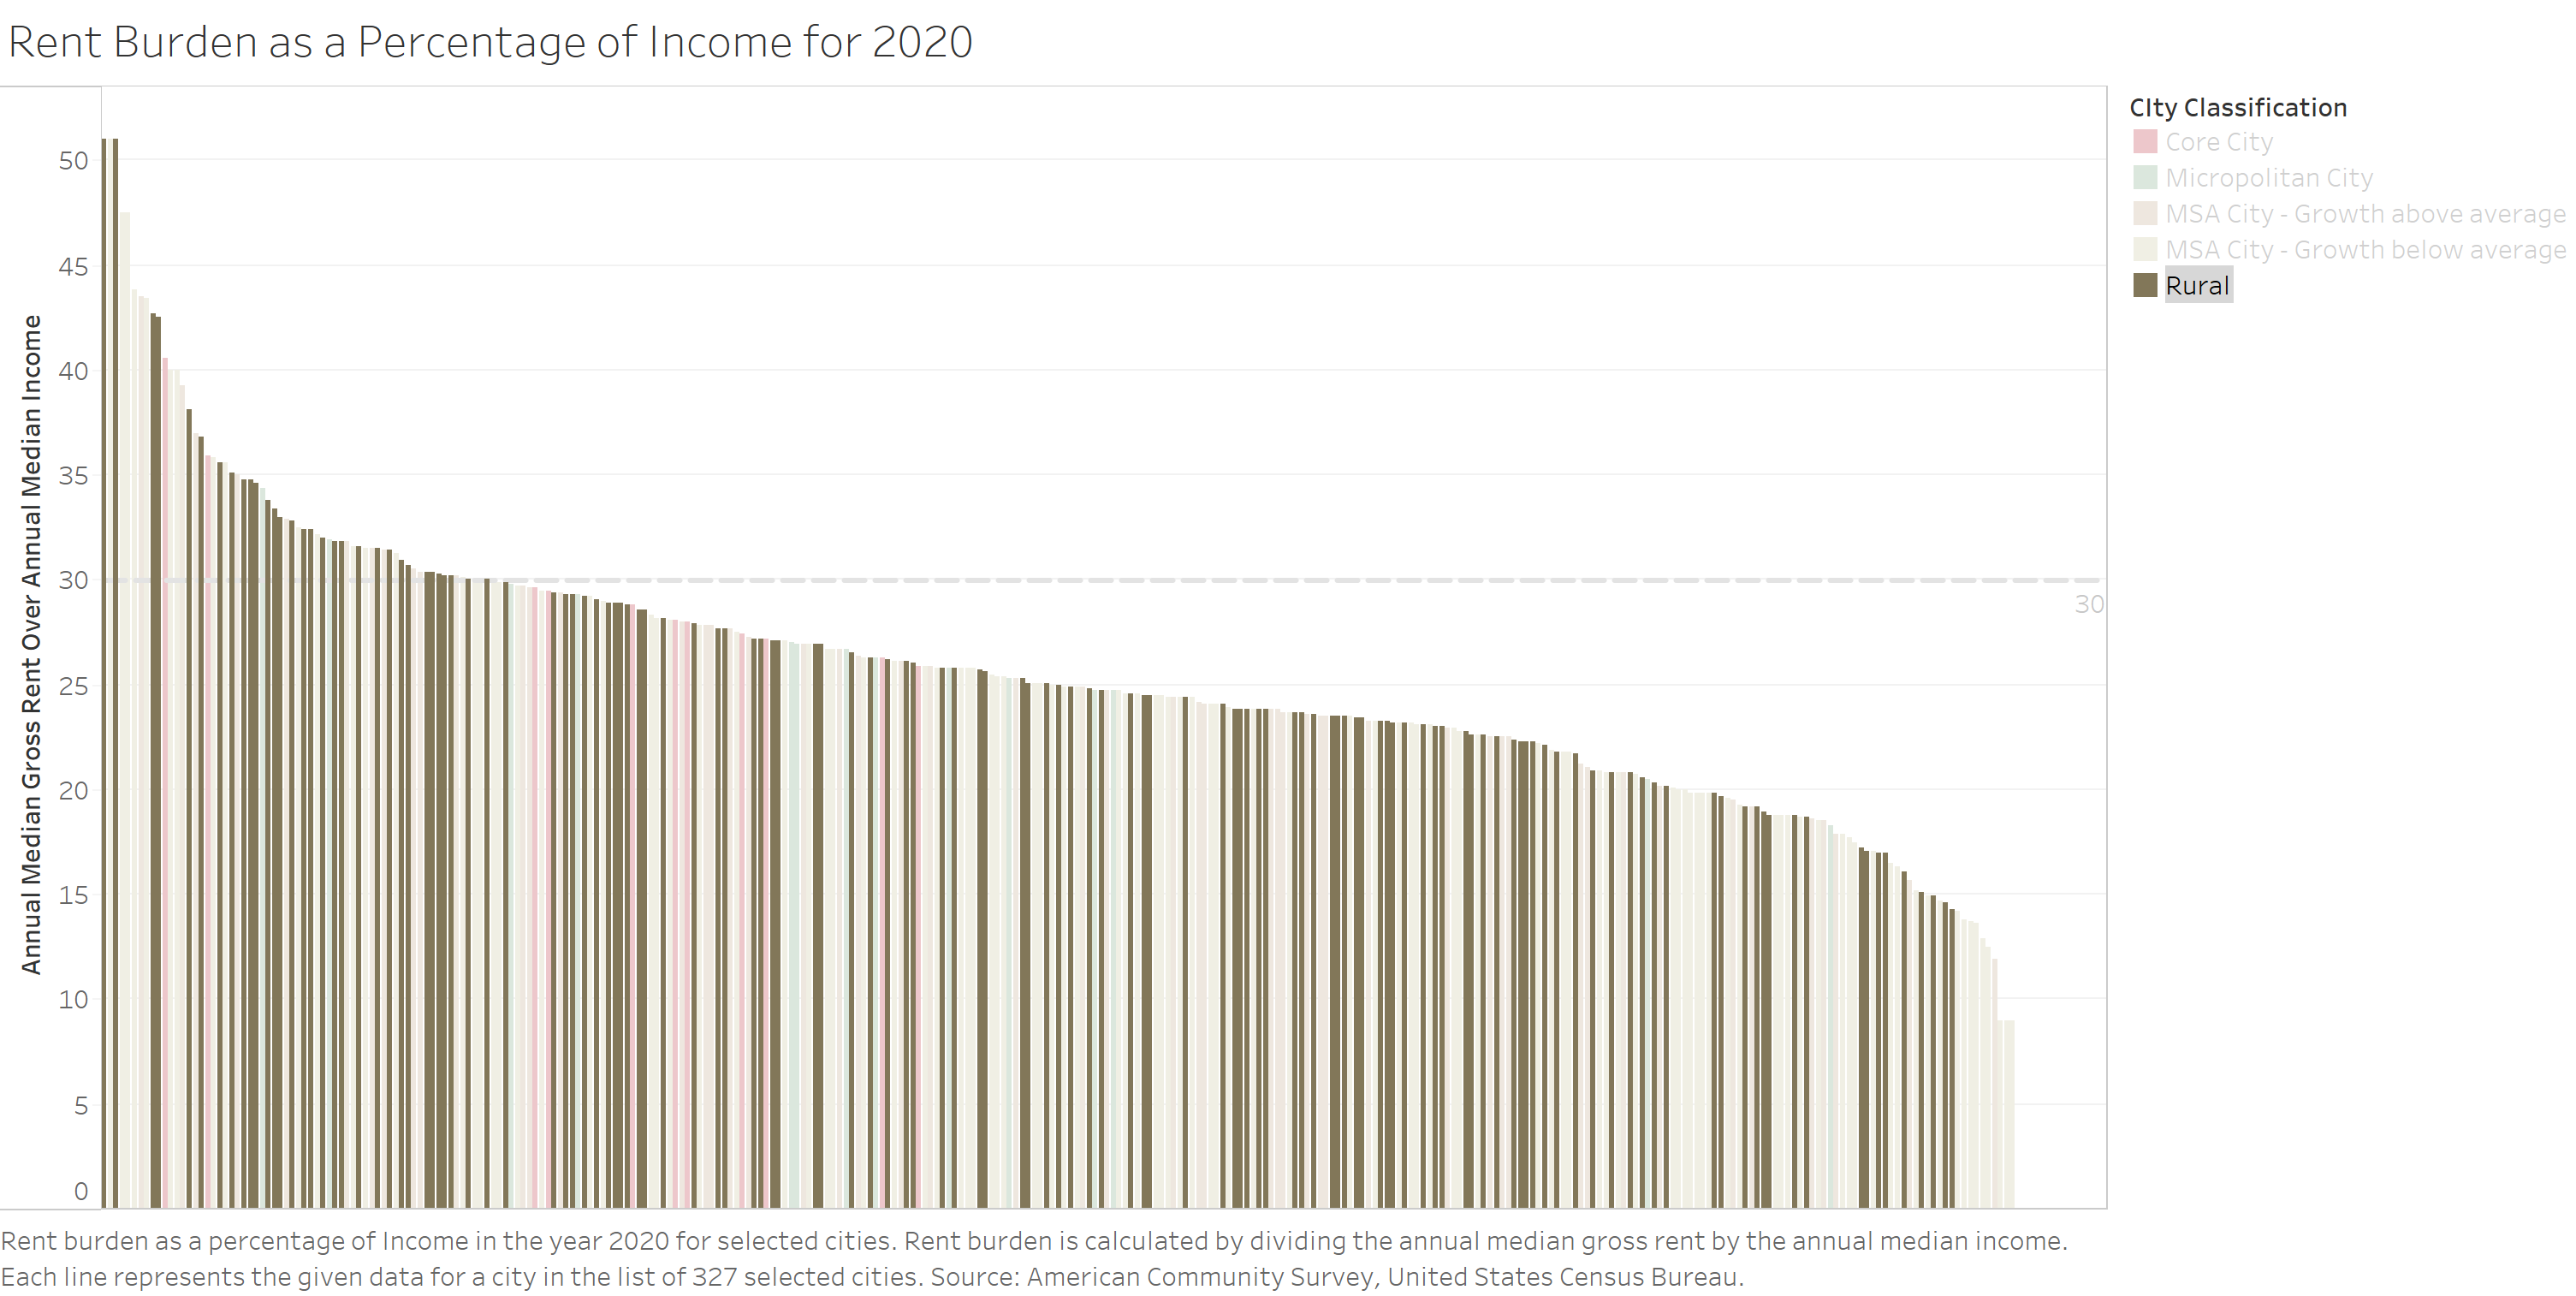
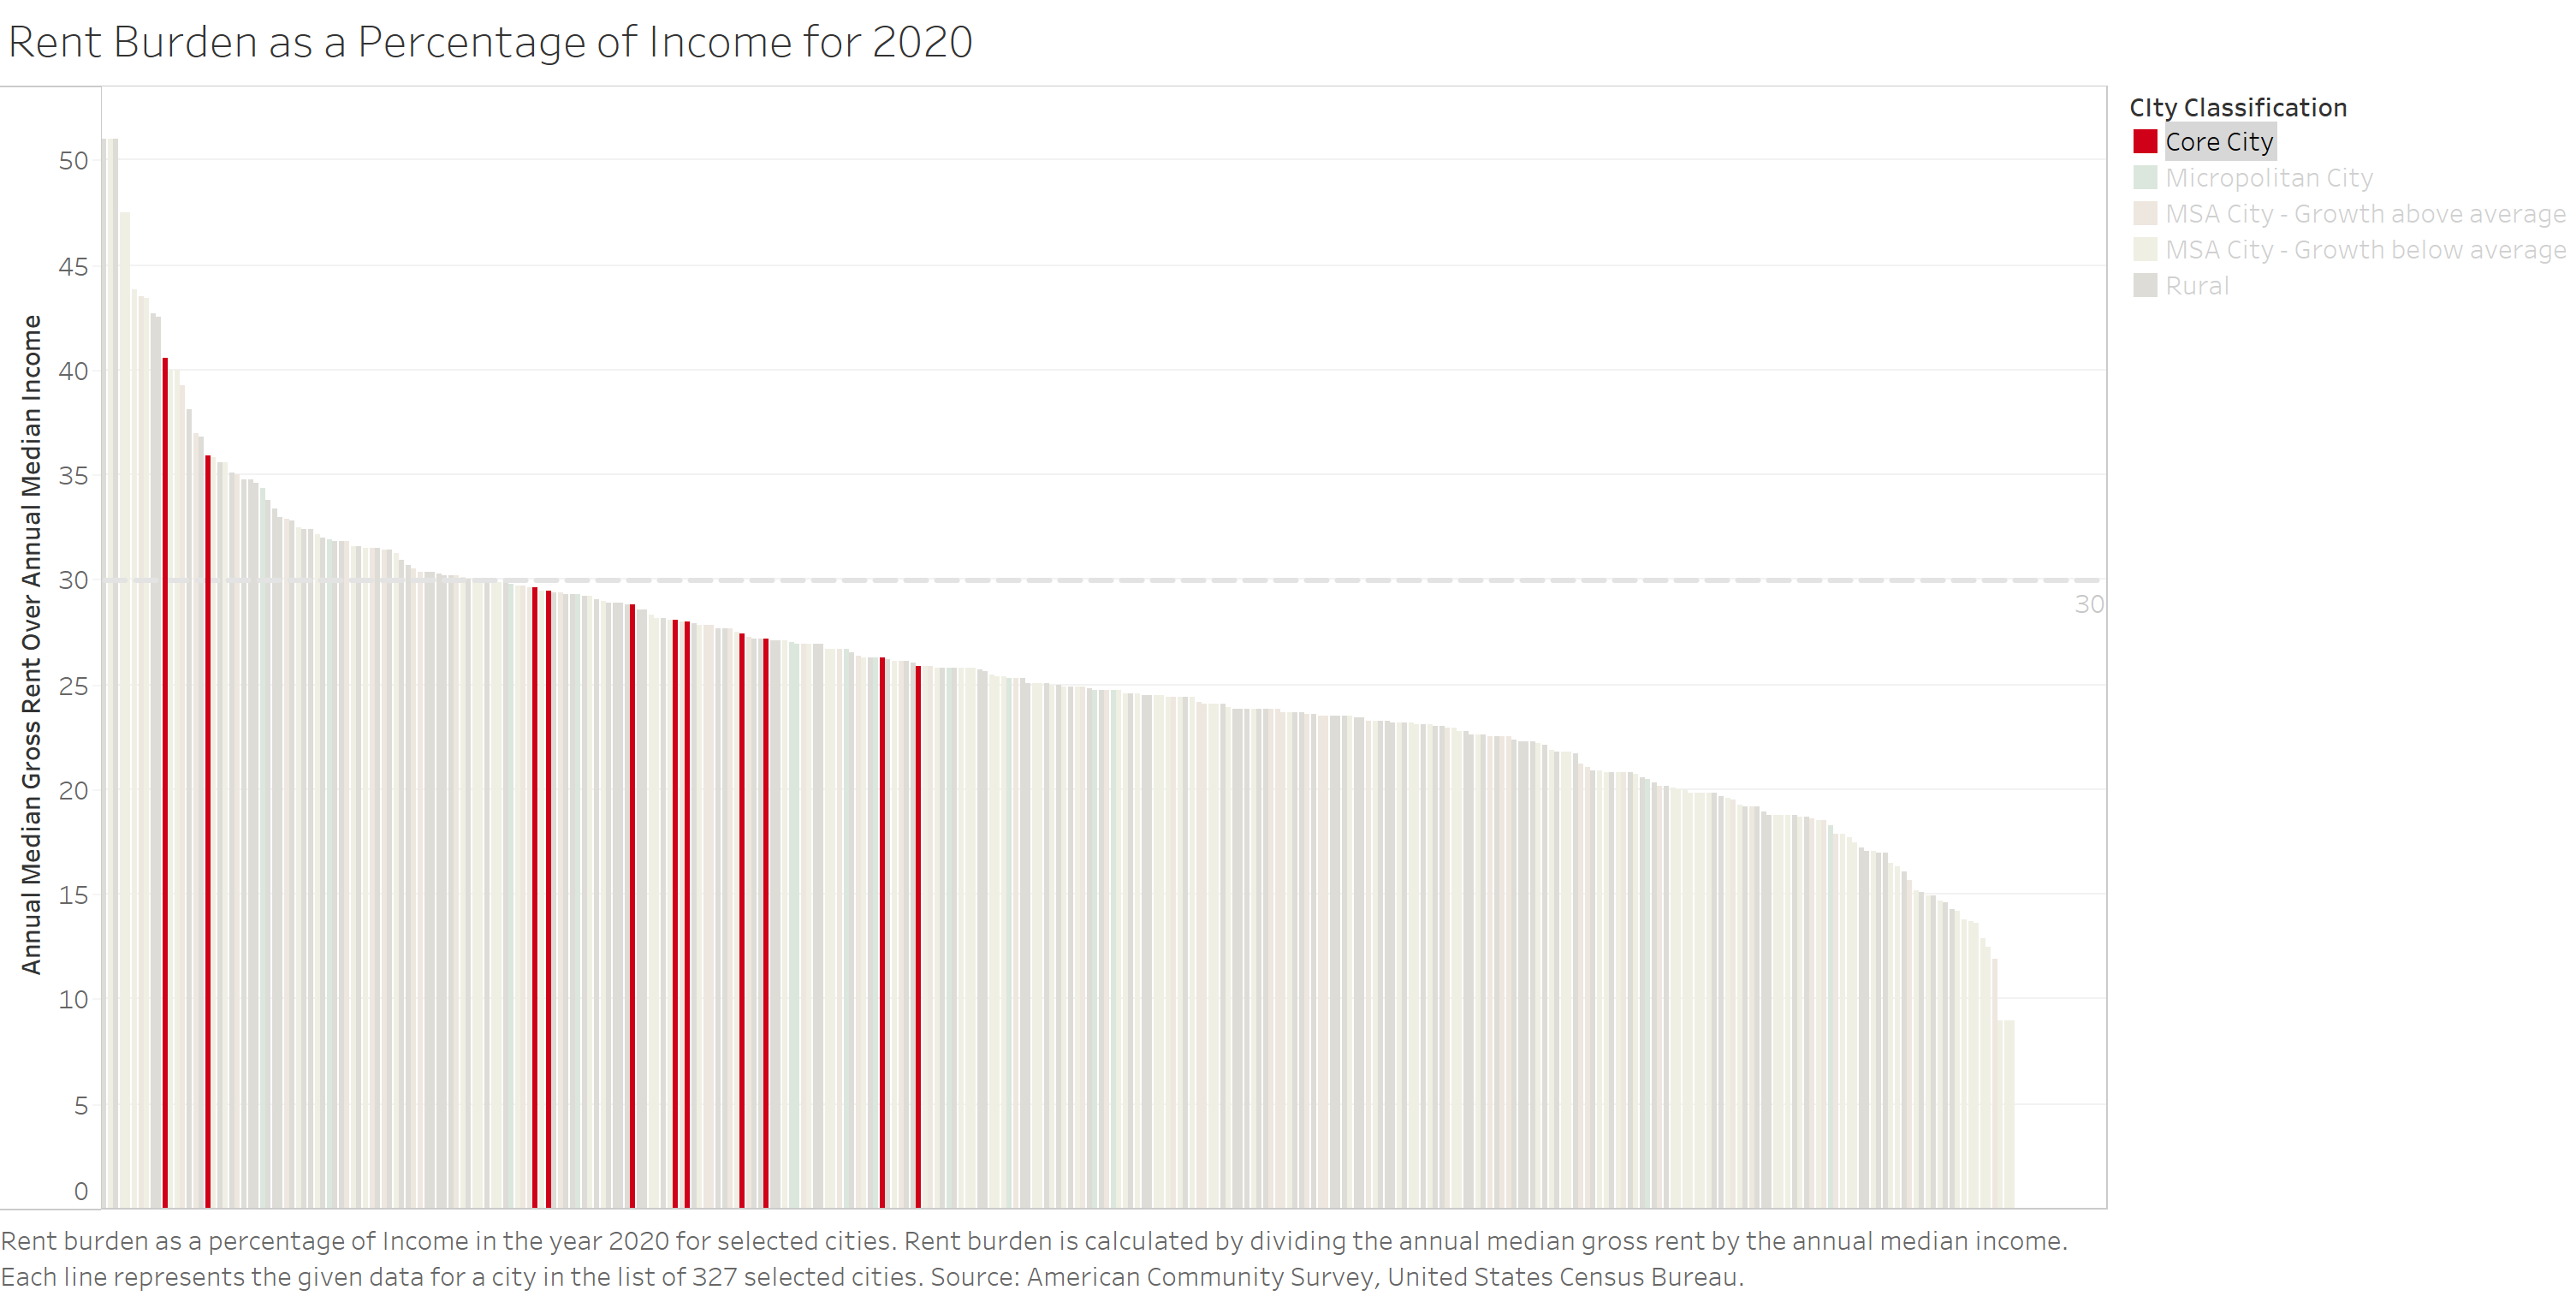
Rent as a Percentage of Income by City Classification
For rent as a percentage of income, we divided annual median gross rent by annual median income, multiplied by 100. The dashed line at a constant 30% (Kober (2021)) is the Cost-Burden Line. If a resident spends more than 30% of their income on housing, then they are considered cost-burdened. The cities that are above the cost-burden line have a rent/income percentage that is above 30%. The patterns within the distribution of the city types are nearly indiscernible, aside from the placements of the core cities. The core cities are consistently high, meaning their rent prices are higher in proportion to their income. The two core cities that are nearly the highest in the state are Ames and Iowa City. Both are college cities with many low-income students renting, increasing costs of rent.
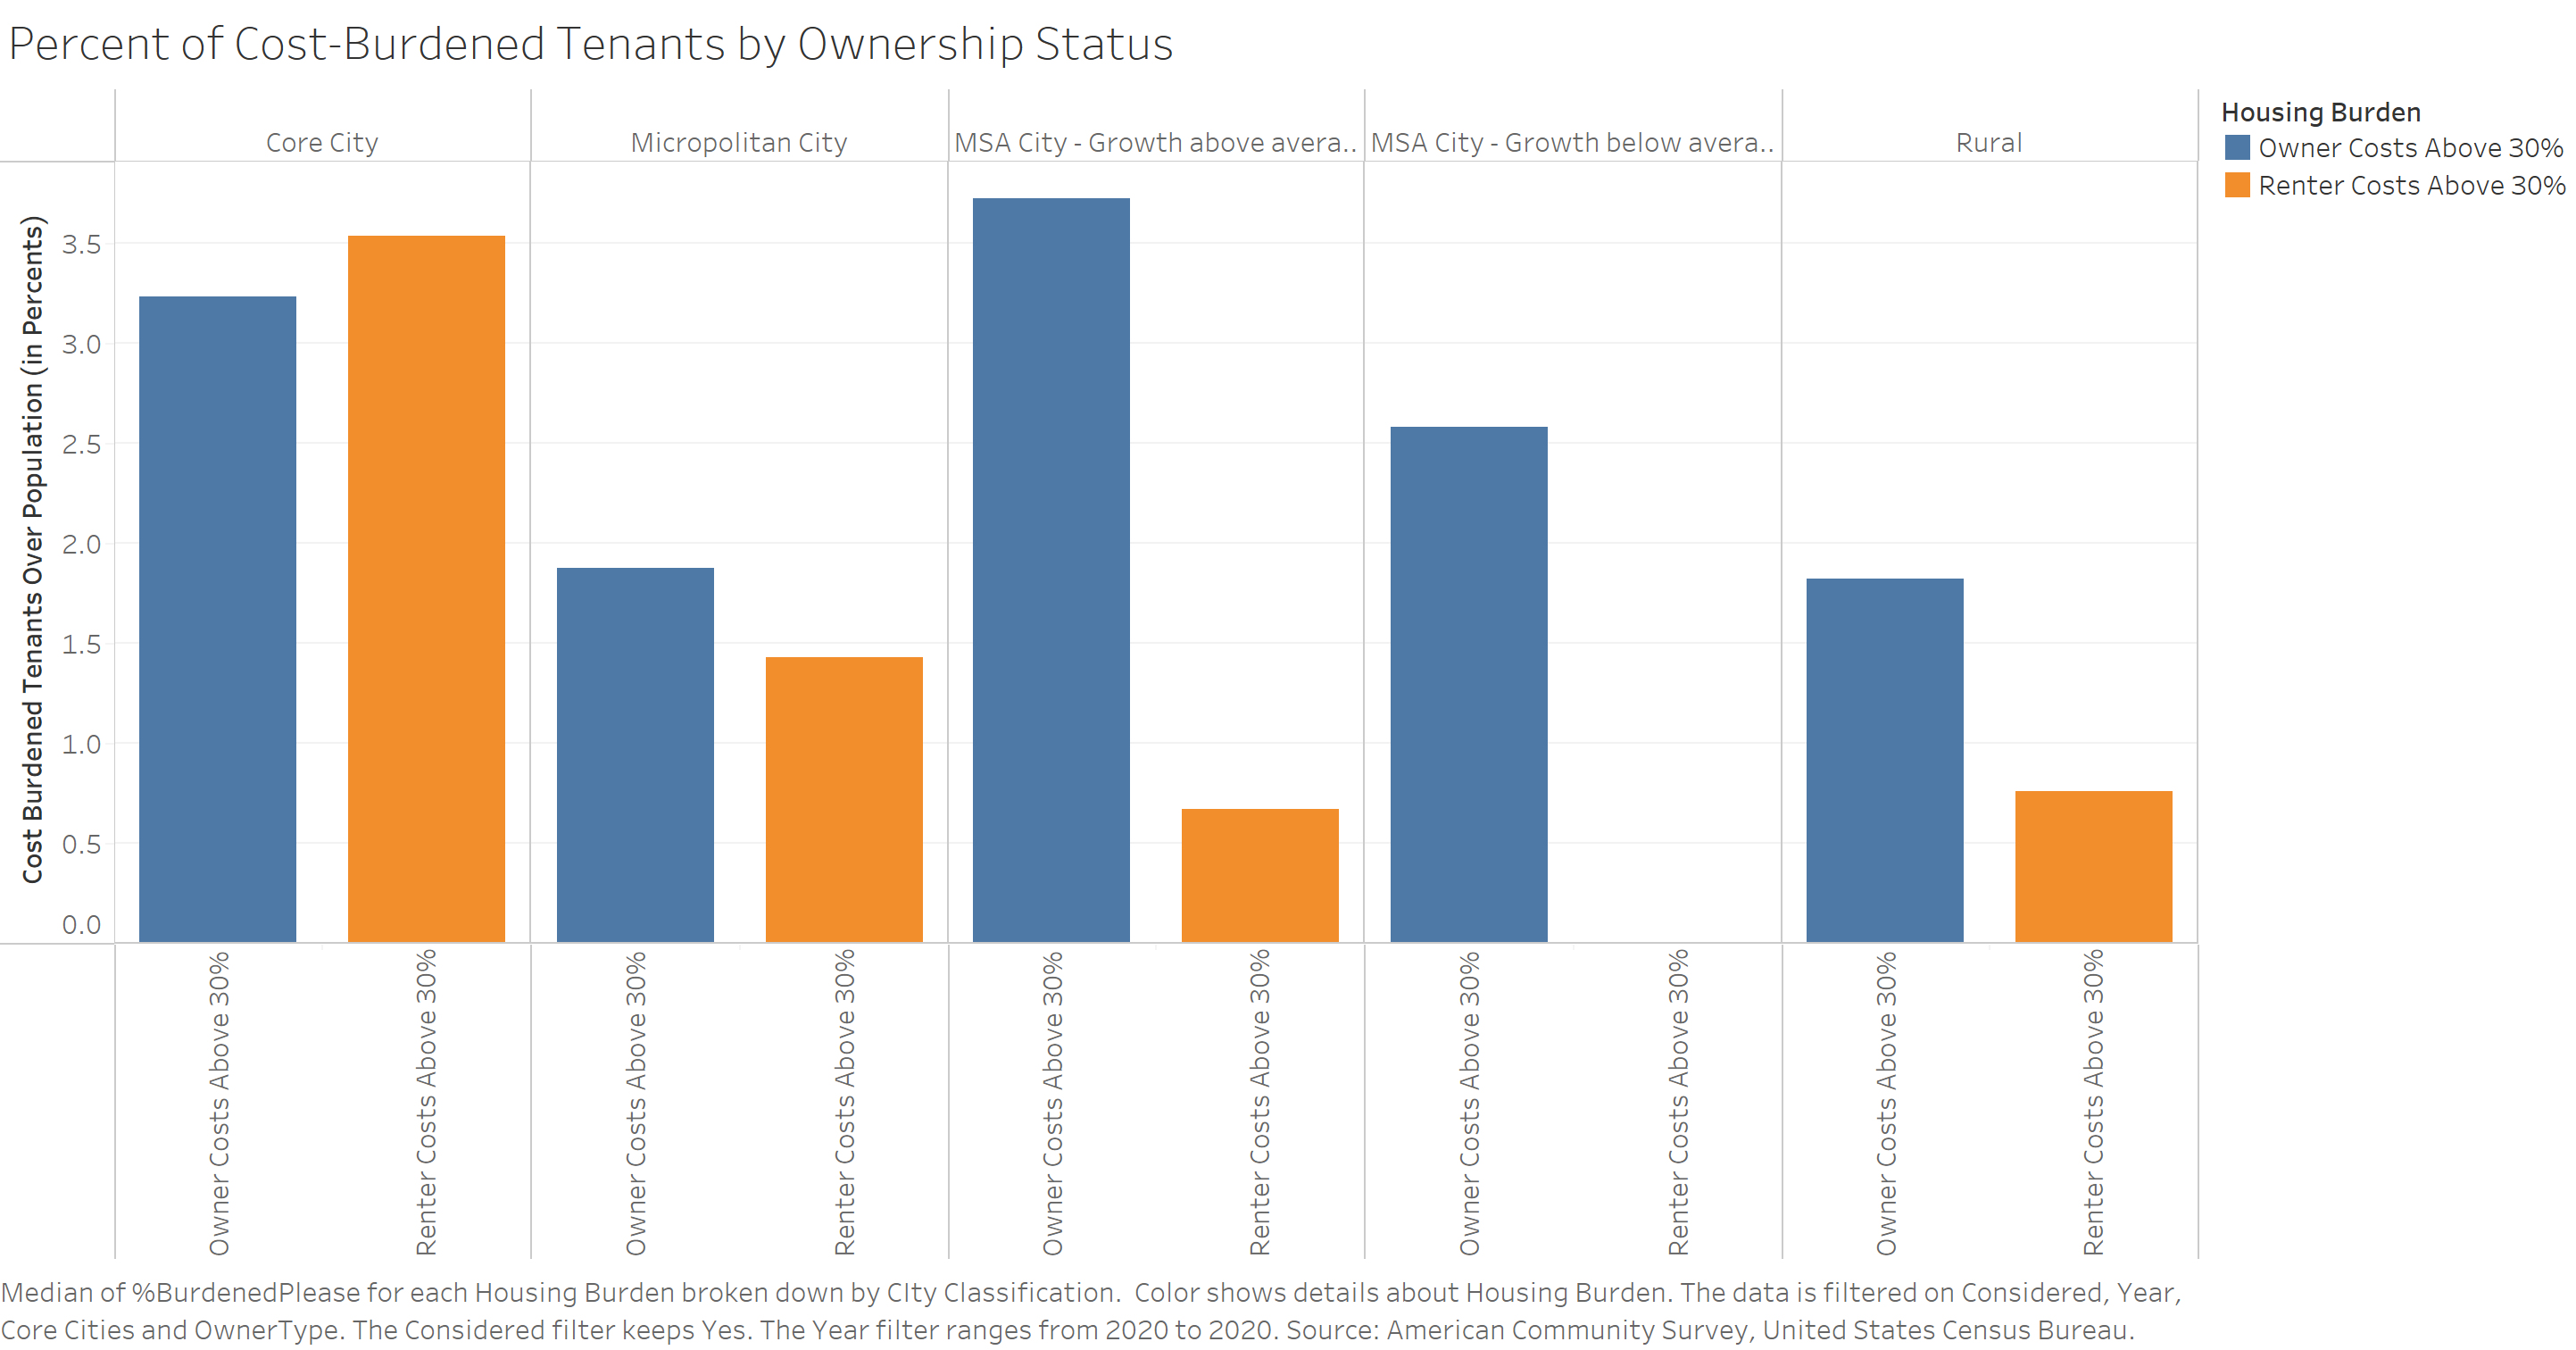
Cost Burden
The below graph shows the percent of owners and renters who are cost-burdened by their housing or rent costs. As stated previously, the standard rule of thumb for cost-burden from housing is 30% of income. The residents represented on the below graph are spending more than 30% on housing or rent.
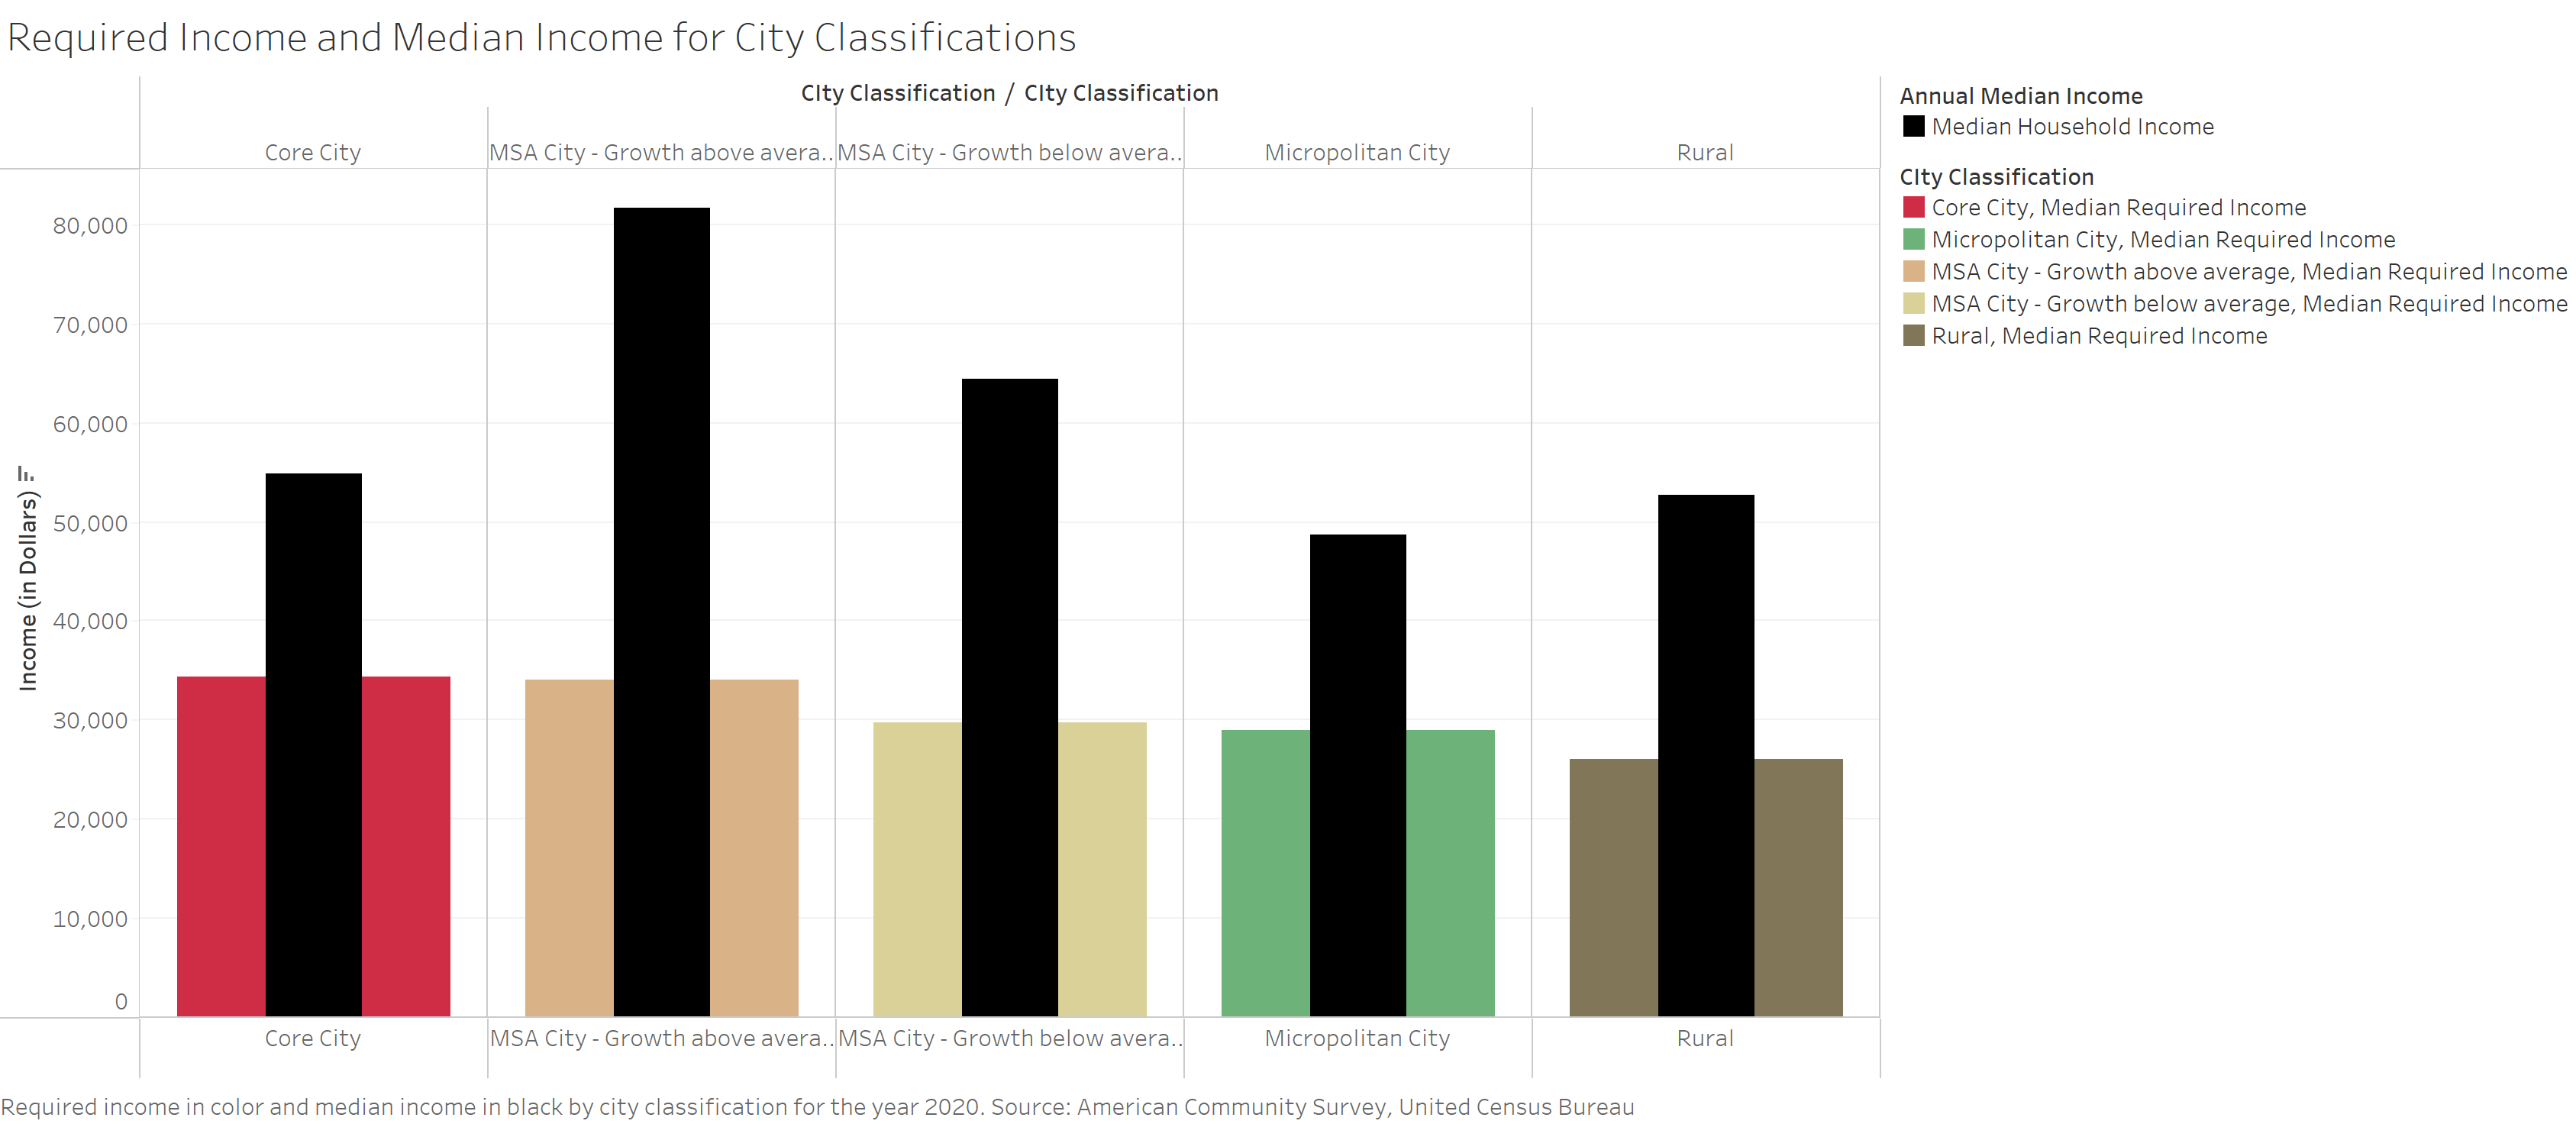
Required Income with Median Income
We have defined the required income as the income that a resident would need to afford the median gross rent with 30% of their income. For example, if their rent costs $30,000 per year, a resident would need $100,000 for the rent to equal 30% of their income. Required income does not mean a resident needs this amount of money to live in a certain city, nor is it a judgment stating that they should earn this much money. It is simply a measurement to determine rent affordability. For the below figure, the black bars represent the true median income for residents of the city classifications. The colored bars are the required income of the city classifications. If the colored bar is greater than the black bar, then the required income is greater than the median income for that city classification. Housing is less affordable. If the black bar is greater than the colored bar, then the median income is greater than the required income. Housing is more affordable.
Next Steps
After researching zoning laws, we have found that cities of similar sizes tend to write their codes in similar ways. For example, large cities tend to encourage high-density development, whereas smaller cities tend to require larger setbacks and lot sizes, lowering density. We are working to determine the economic impacts of these zoning decisions, particularly their impact on the housing market. We seek to understand how zoning laws may increase or decrease factors, such as the cost of rent, income, and home values. Zoning is not the only factor, however. The overall state of the economy and job market are also important to consider.
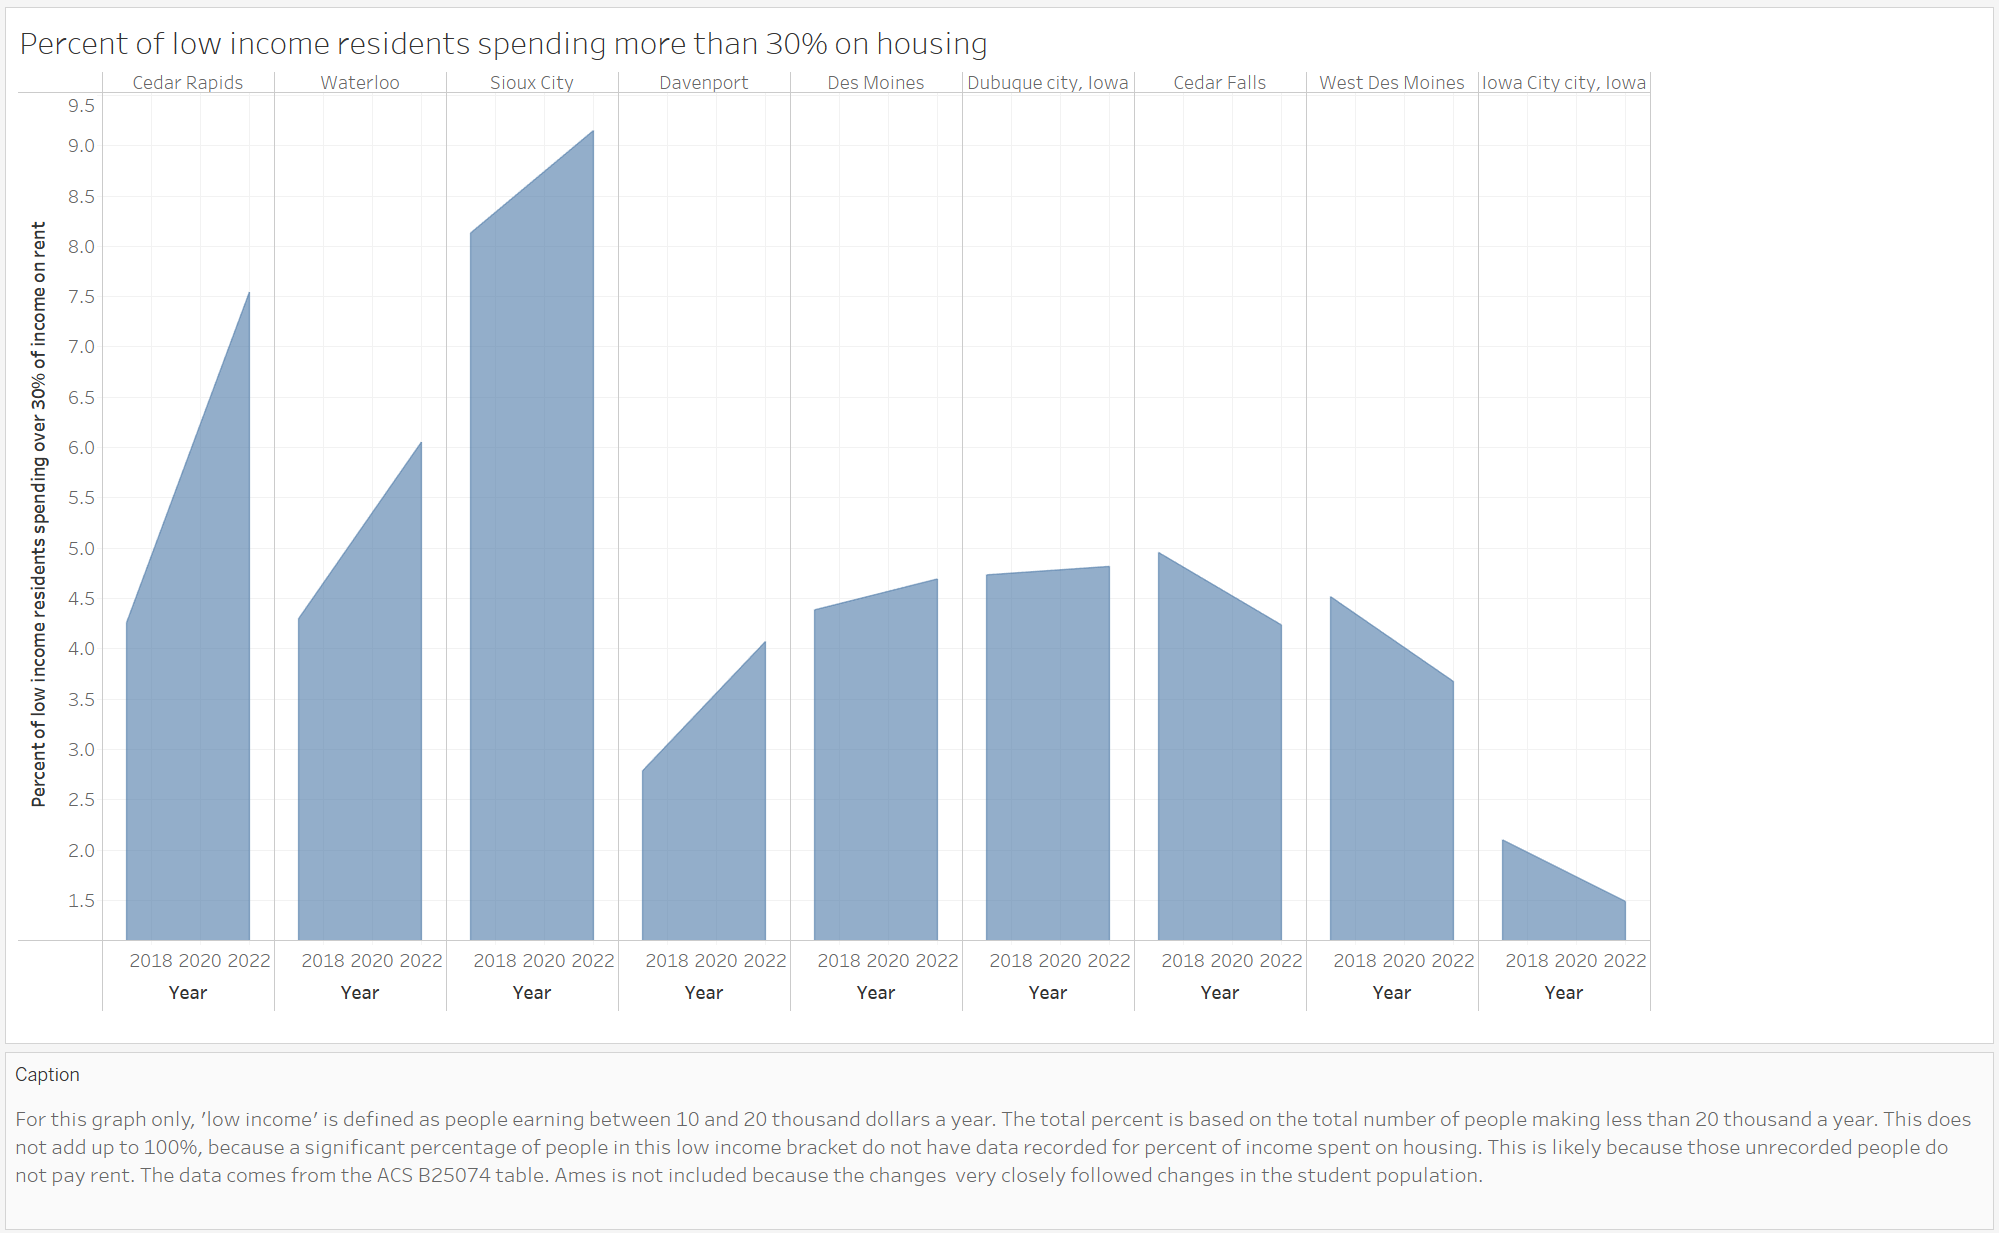
Cost Burden for Low Income Residents
Jobs and Vacant Housing
We have chosen to represent the availability of housing units as the percent of vacant housing units over the total population. This number provides insight into a given city’s capacity to handle housing demand. This variable is limited because it includes units that are vacant because nobody wants to live in them, but it provides a closer representation of yearly data than housing permits, which represent the growth that will be available in a few years after the housing units are built. We are representing the demand for housing as the percentage of new jobs over the total population for a given city. This is because jobs are frequently what drives growth in a city, and the data is less likely to be skewed by children.
We are interested in finding cities that need to change their zoning code or building practices in order to accommodate new growth, so it’s important to first look at the supply and demand in growing cities, which is exactly what the following diagram maps.
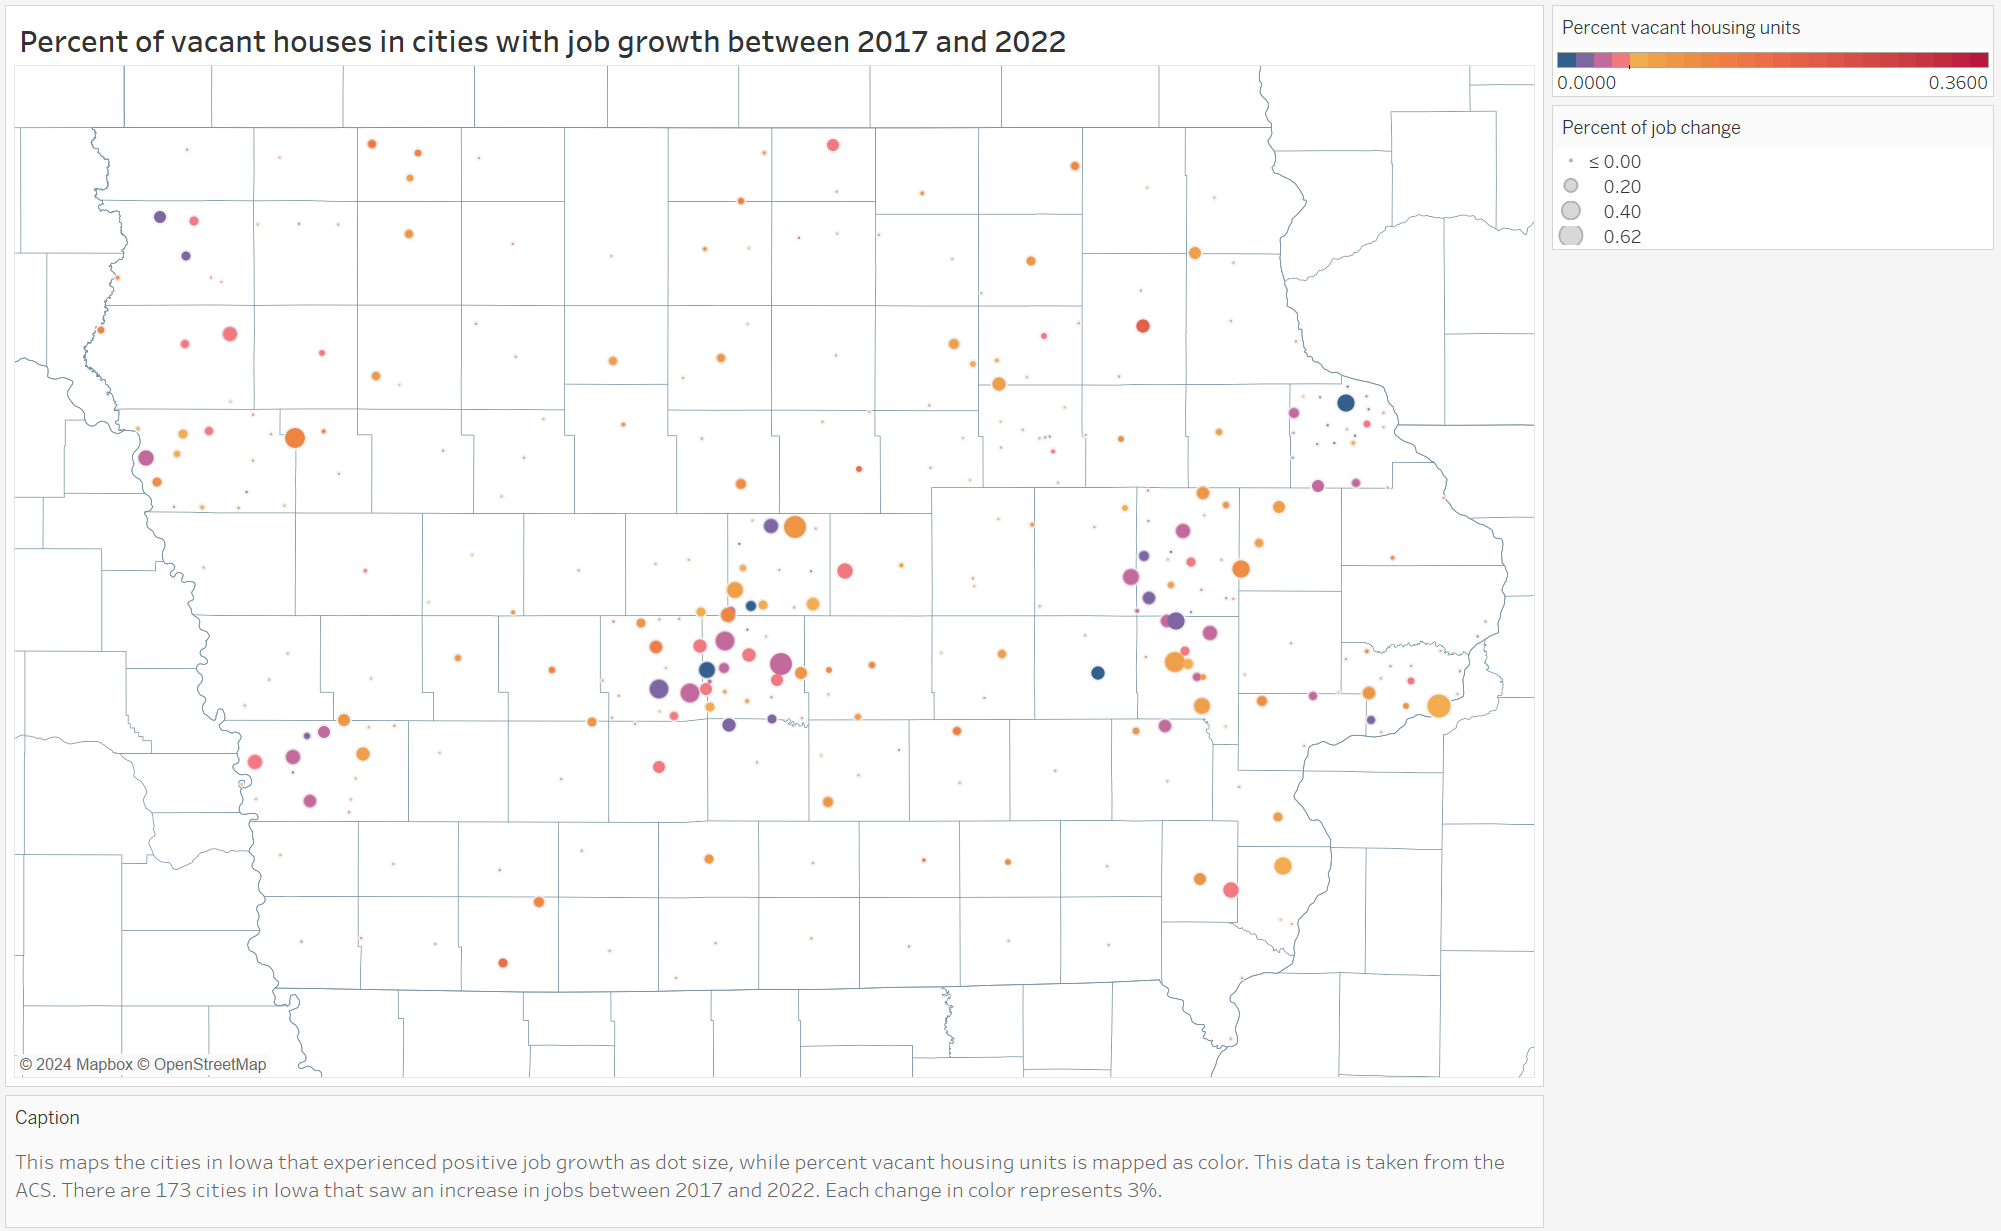
There are five main clusters of cities with larger increases in jobs and lower amounts of vacant housing. In the center of the state, Des Moines, West Des Moines, and surrounding micropolitan areas saw an increase in jobs and lower housing. The same is true for the Eastern parts of the state around Cedar Rapids and Iowa City, as well as the Western section near Omaha.
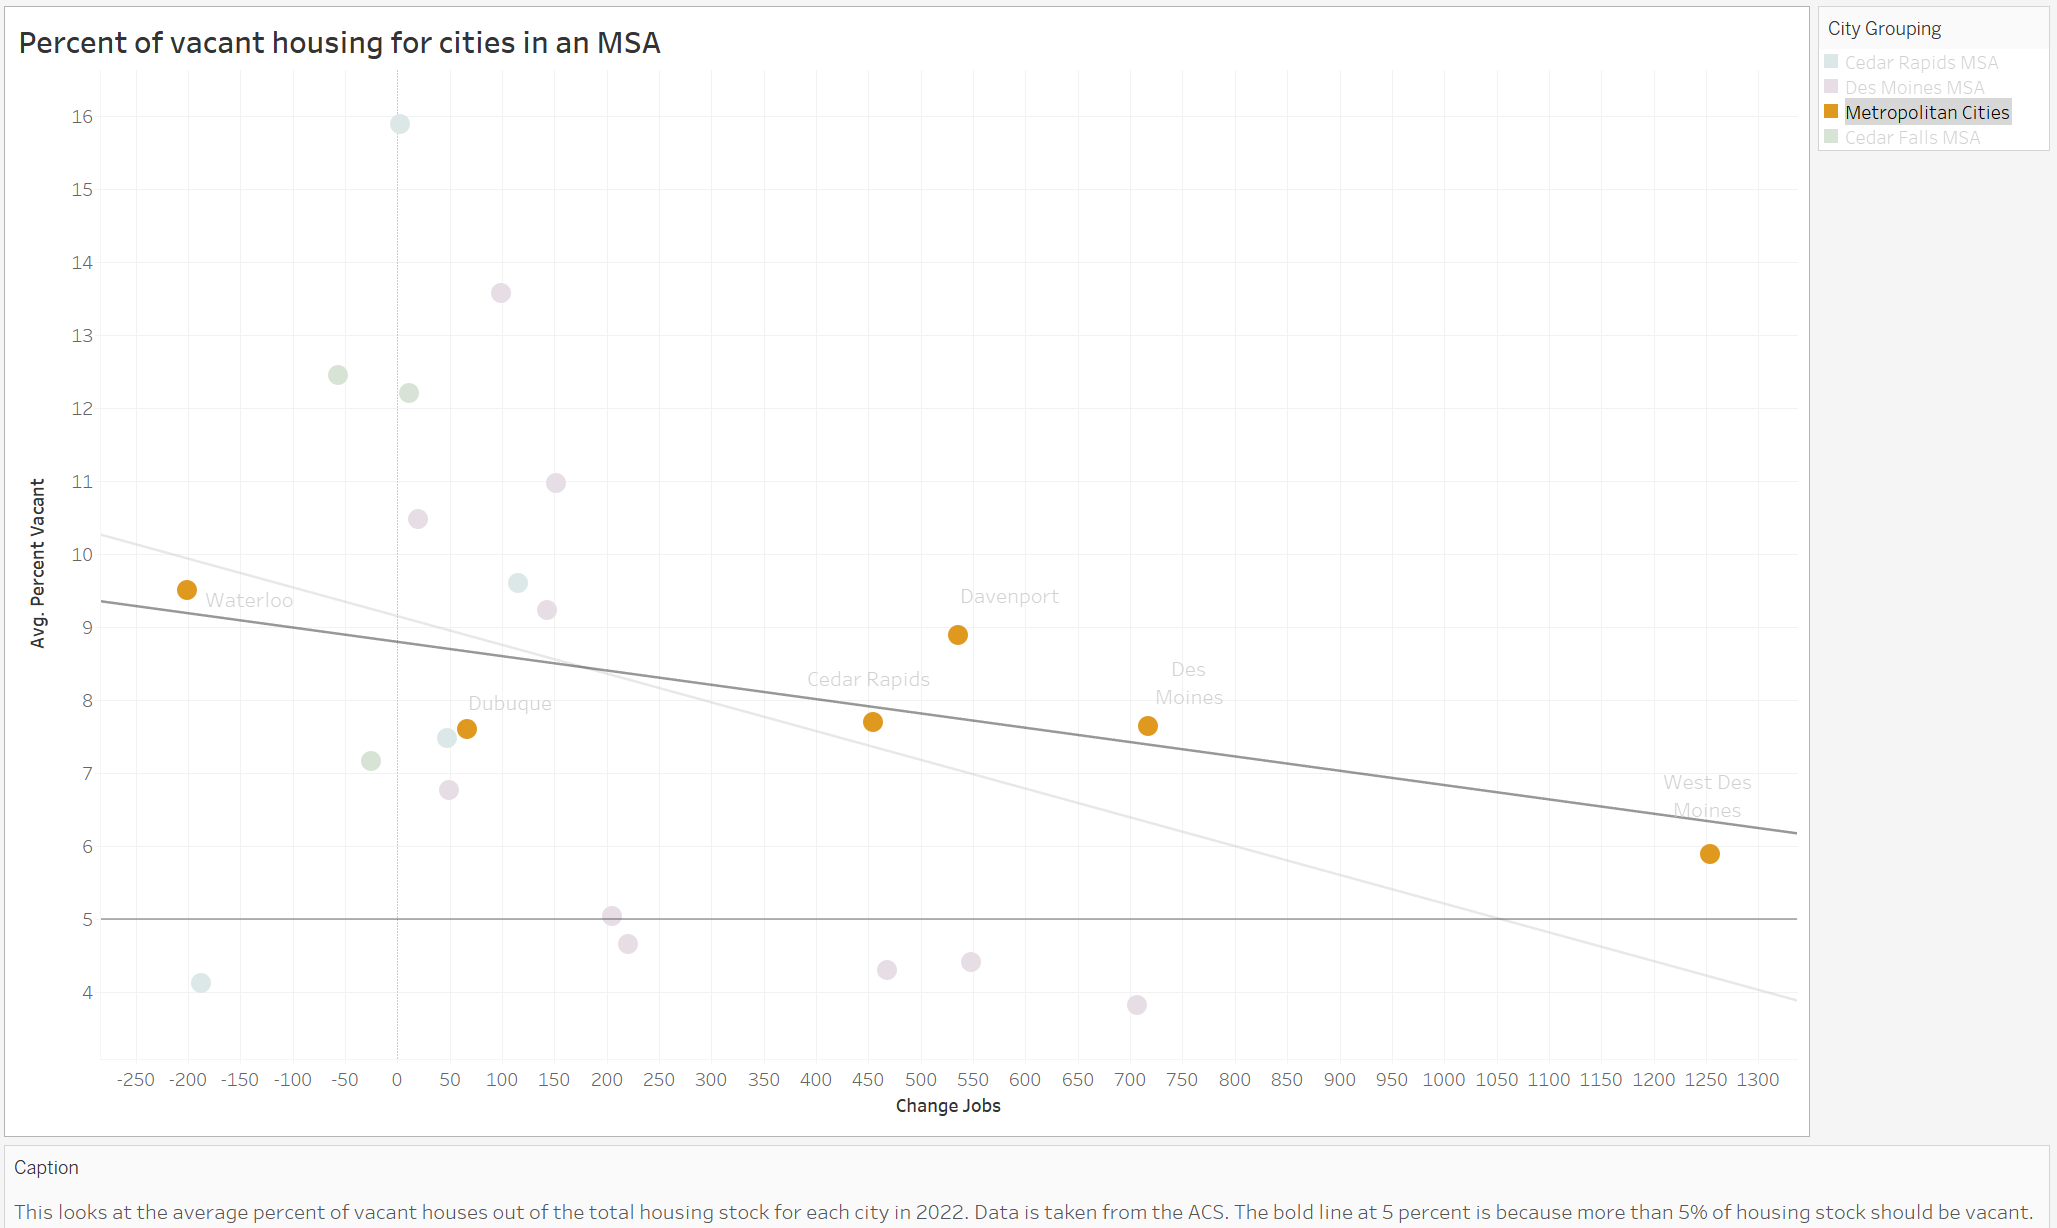
Vacancies in Metropolitan Cities
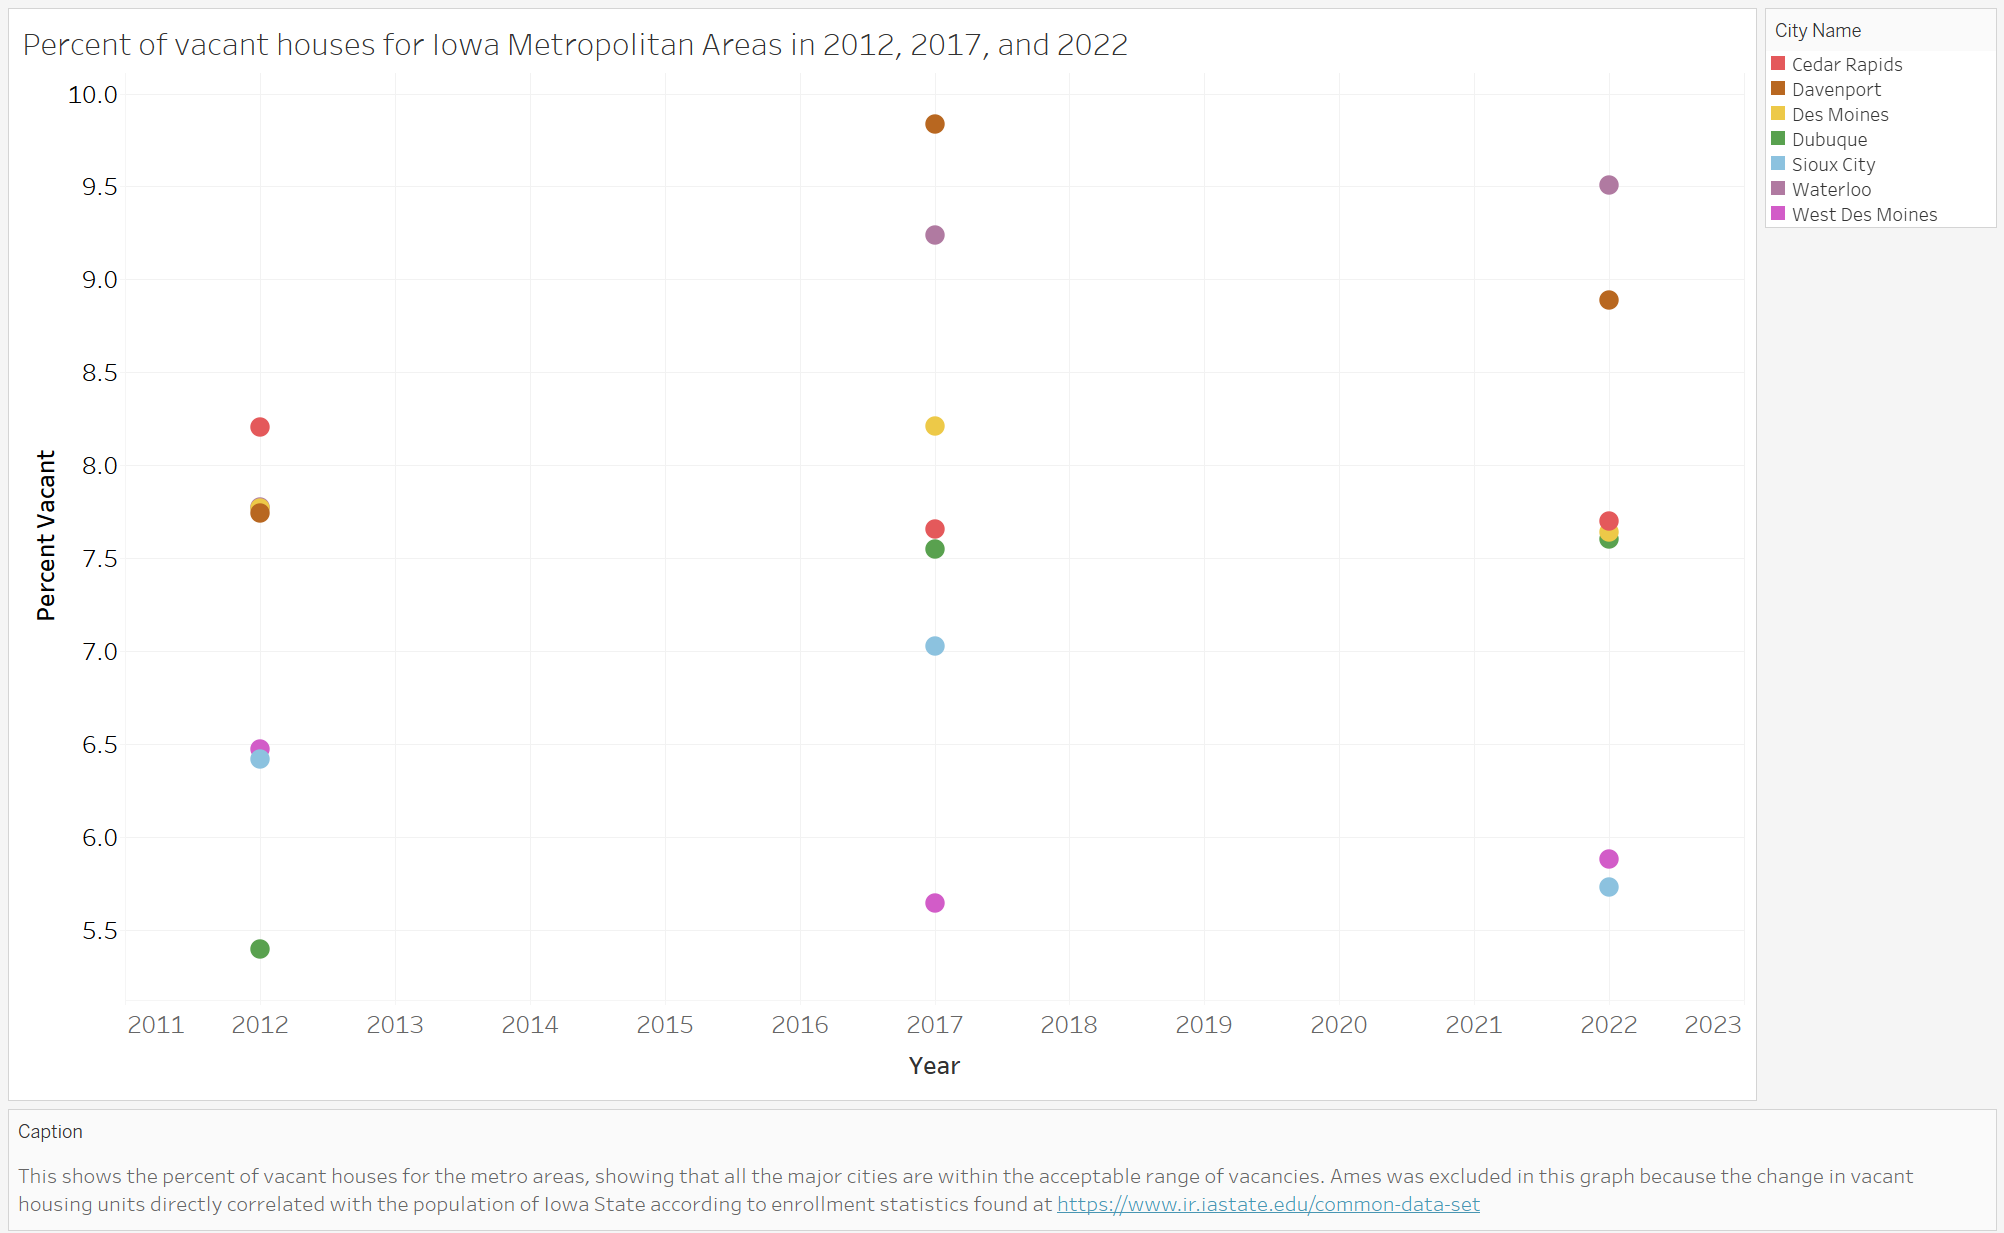
The above shows the percent of vacant housing stock in Iowa’s metropolitan cities. The percentage of vacant housing should be between 5 and 10 percent of a city’s total housing stock (Smith (2023)).In 2022, all of them fall within the ideal amount of housing to have vacant. Davenport’s vacant housing dropped between 2020 and 2022, putting it at a healthy percent of vacant housing. Sioux City and West Des Moines, in orange, are both within the healthy percent of vacant houses out of the total housing stock, but they are decreasing. Given how close they both are to falling under 5% vacant housing stock, it’s likely that these cities should work to increase the rate at which they build new housing. However, none of the cities are outside the acceptable range, which doesn’t explain the very low percentages of vacant housing stock in the map of Iowa. One reason for this disconnect might be that the areas surrounding metropolitan cities are experiencing percent increases in population greater than that of metropolitan cities.
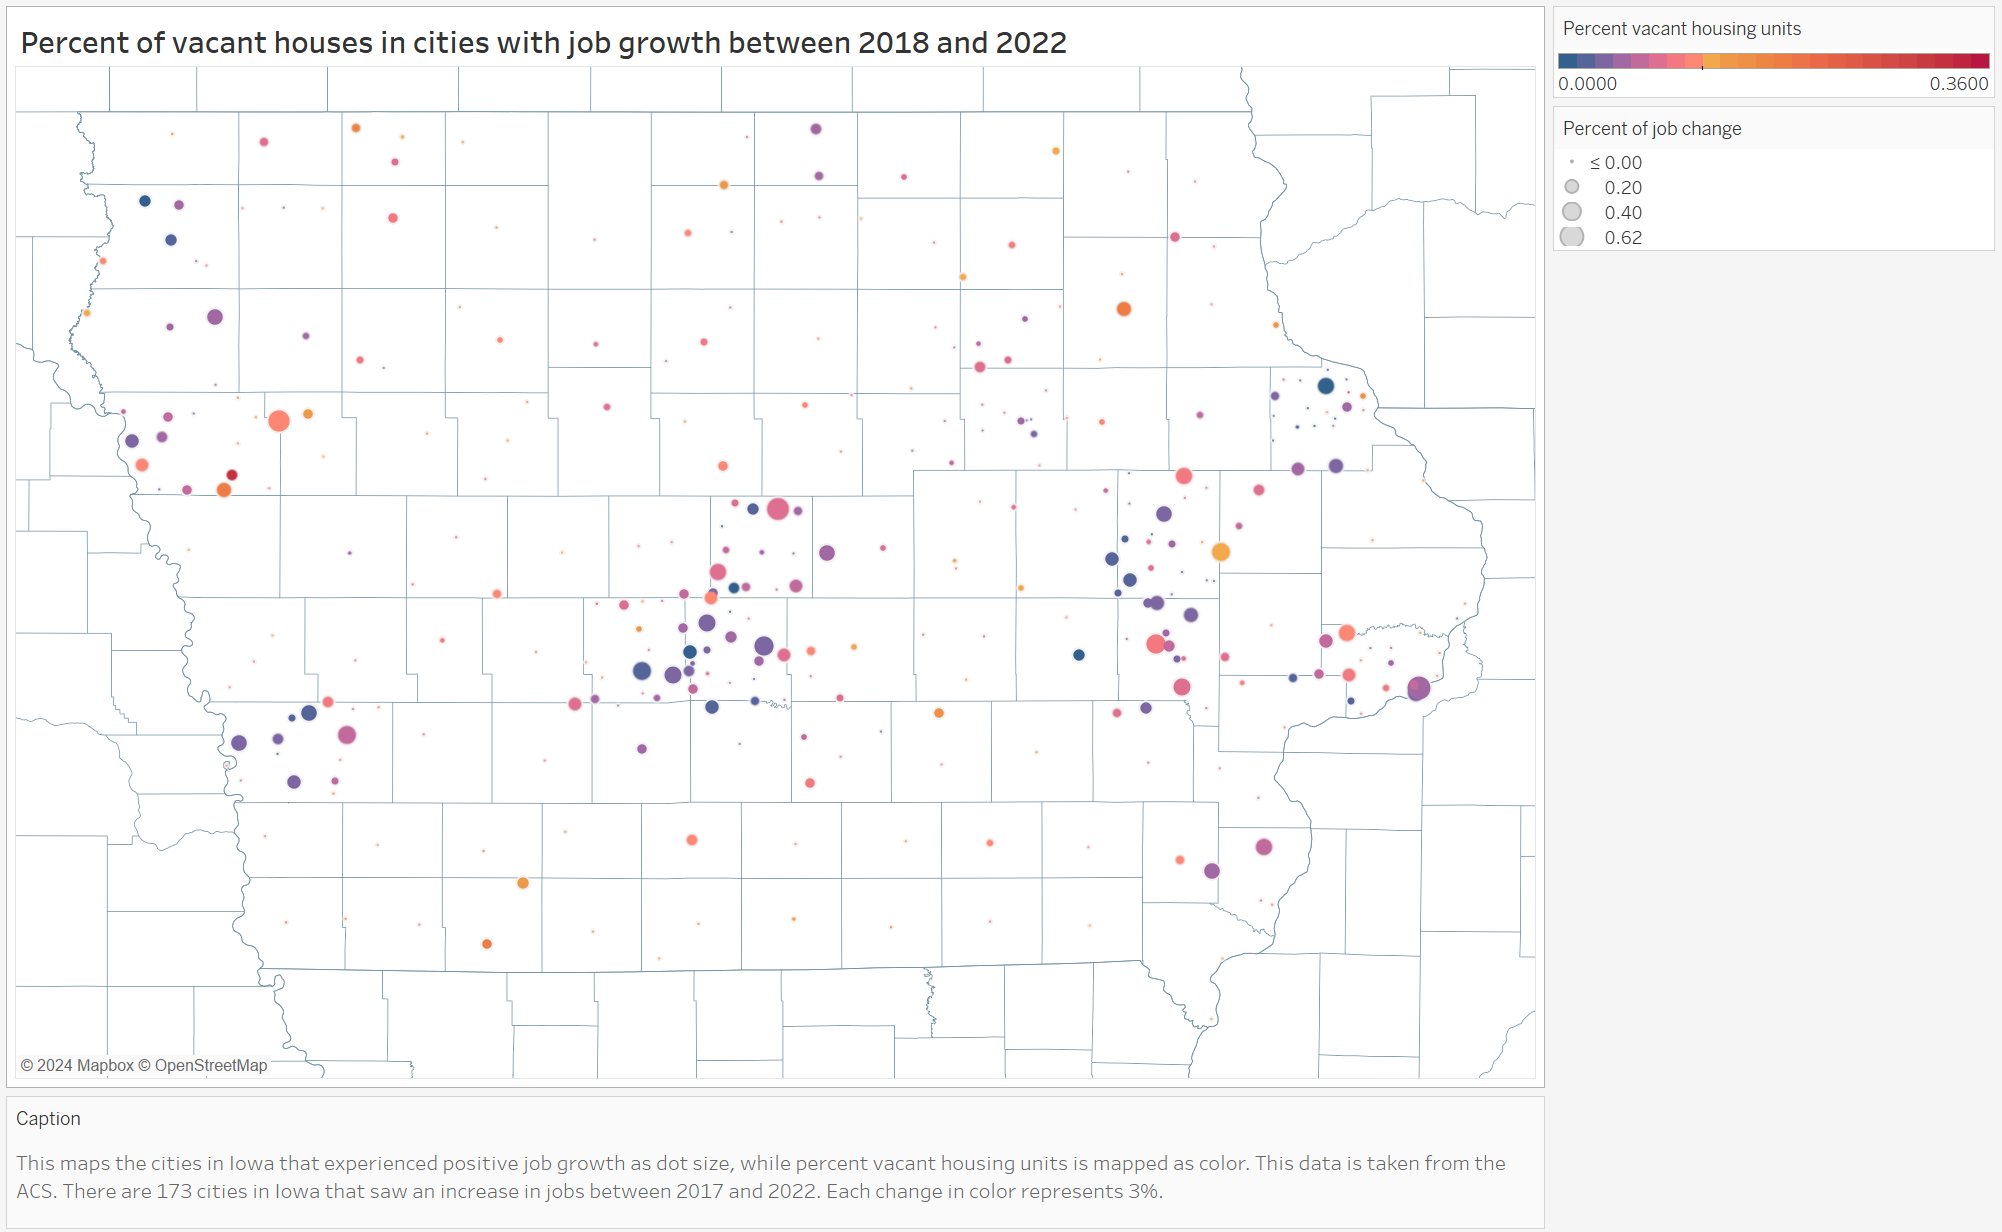
The above map shows that metropolitan cities tend not to have vacancy percentages within an acceptable range. The dark blue on the map represents vacancy rates that are lower than ideal. That dark blue appears most frequently around Iowa Metropolitan cities, which implies that those cities are not building houses at a rate that keeps up with demand.
Vacancies surrounding Des Moines
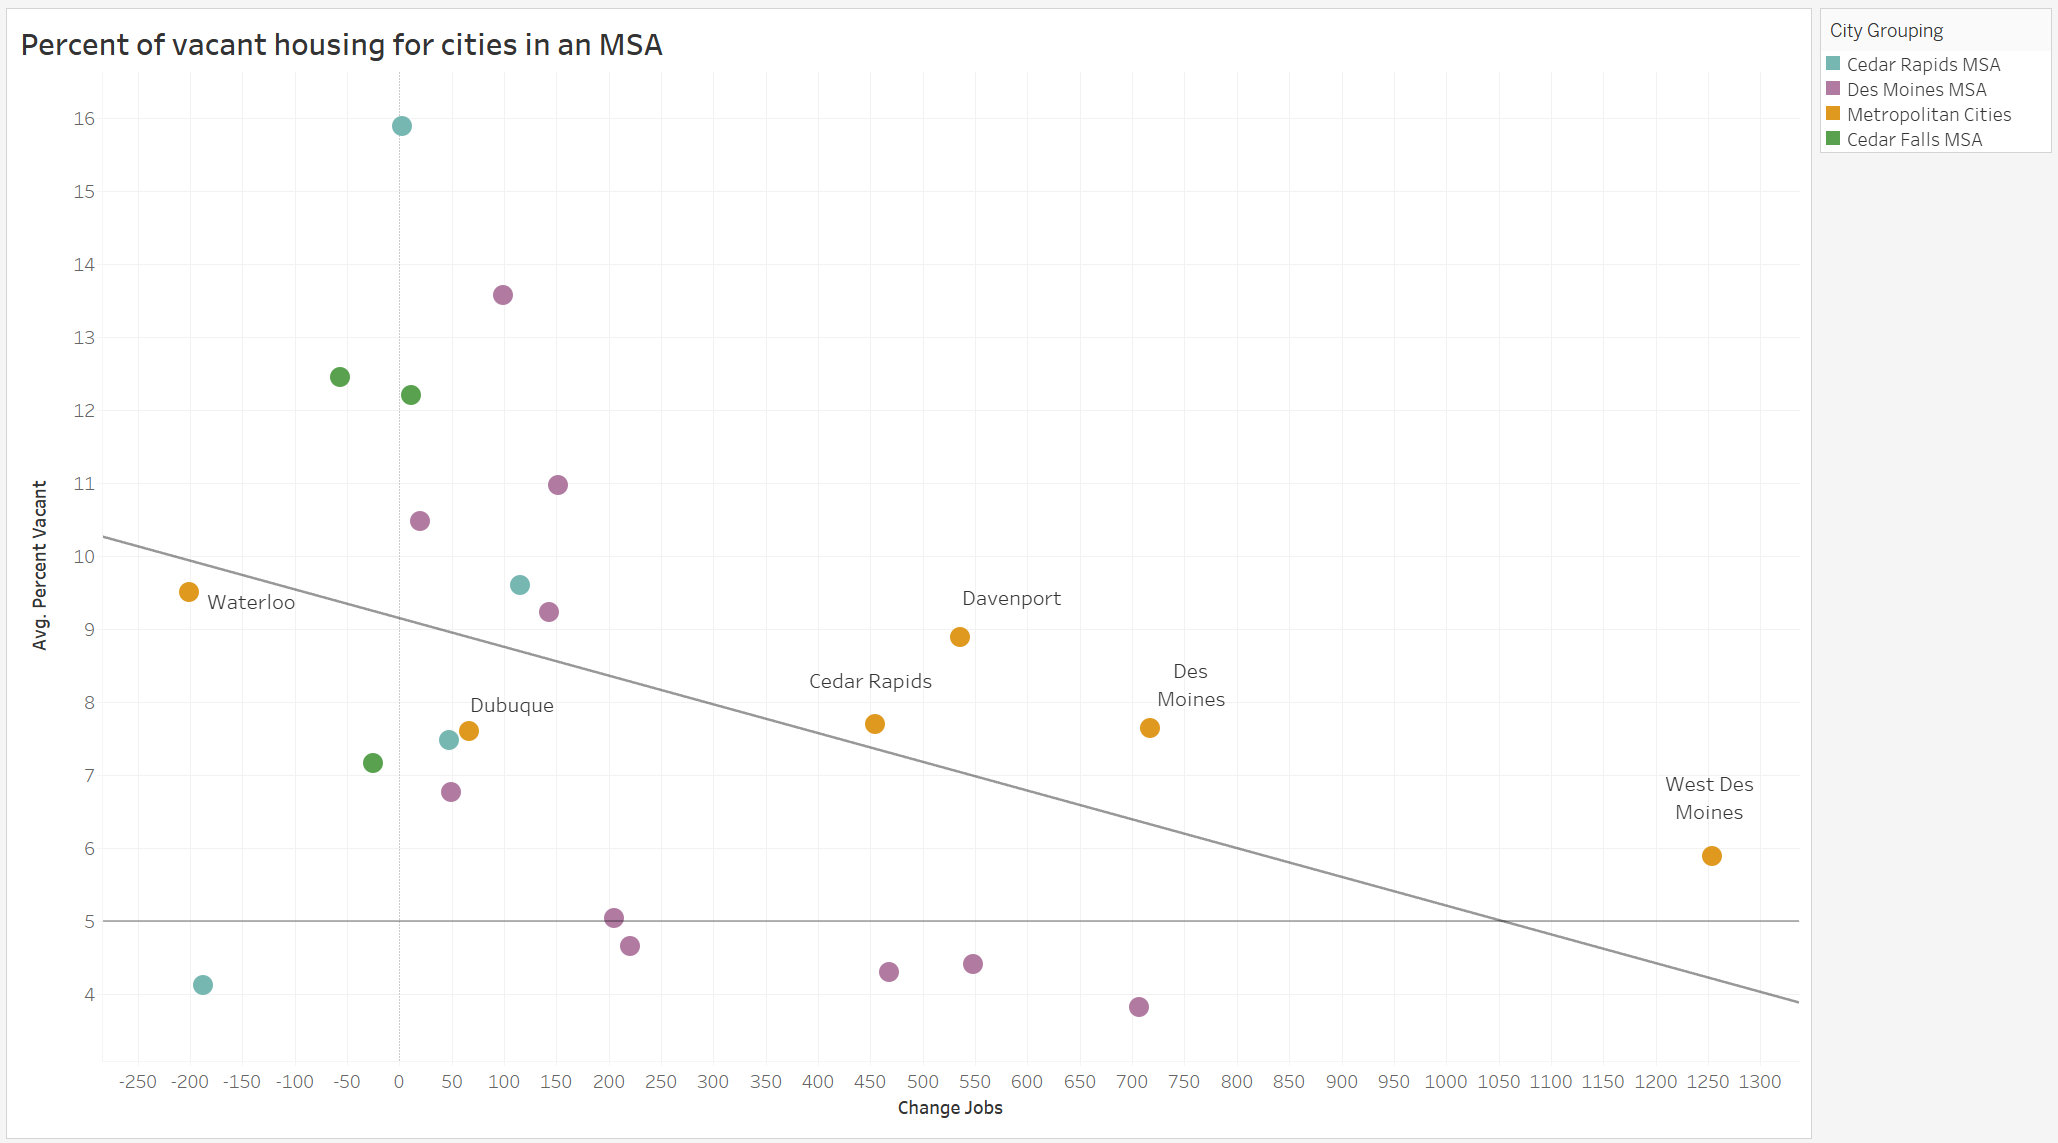
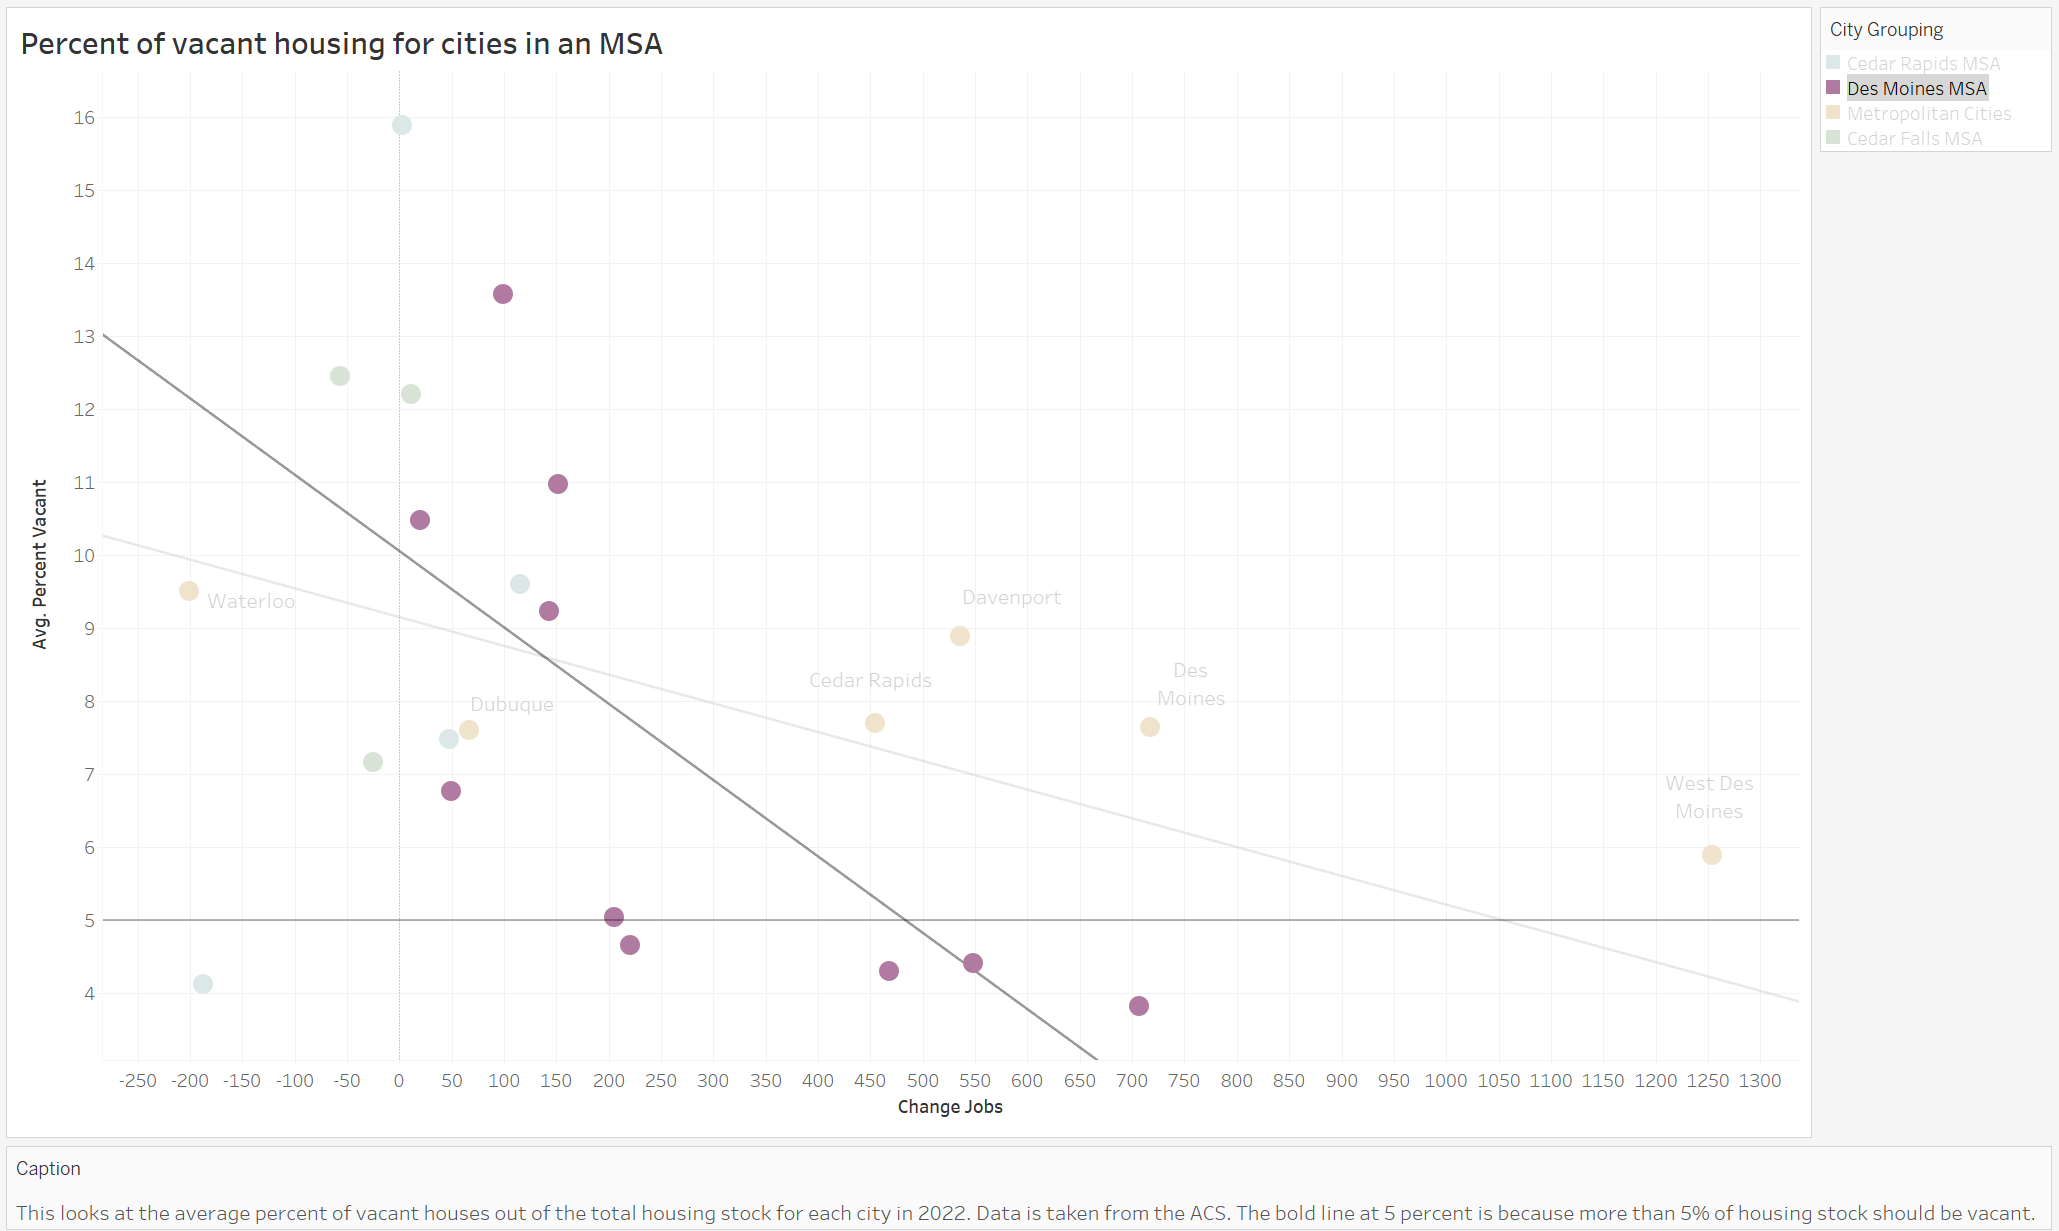
Looking at Des Moines as a case study, we can see that there is a significant difference between the amount of vacant housing stock in Des Moines compared to the cities surrounding Des Moines. Five percent is shown on the chart as a black line to indicate that anything below the line is outside the acceptable percent of vacant housing. While Des Moines may have more than five percent of its housing stock as vacant, many of its suburbs do not have high enough vacancies. This indicates that people are moving to cities surrounding Des Moines at a rate faster than the housing stock can support. This implies that the suburbs are less prepared to handle the population increase than the metro city.
The other cities in an MSA do not have enough data points in each graph to draw a reasonable conclusion as to what is happening there.
Conclusion
Based on the findings of this report, it is clear that the cost of housing is increasing across Iowa. Furthermore, the availability of housing in Iowa is decreasing compared to the population growth. This is especially true in core metropolitan cities, where the disparity between the income needed to afford rent without becoming cost-burdened and the actual income of residents are greatest. This disparity makes it harder for core city residents to afford housing,
The disparity of incomes to rent prices, increased housing costs, and decreases in housing availability all warrant policy changes to aid Iowans. Amongst other legislation pertaining to managing housing costs, zoning can affect how many living units can be built in one area of a city. The more housing units available as per the needs of the people residing in the place the more likely the place is far from the housing crisis. The housing crisis is not a binary problem, so in this project, we are dealing with understanding the existing scenario, potential issue areas and the impact and association with Zoning of the City.
Tableau Dashboards
Link to data visualization dashboard for city classifications
Link to data visualization dashboard for job and vacancy data